-
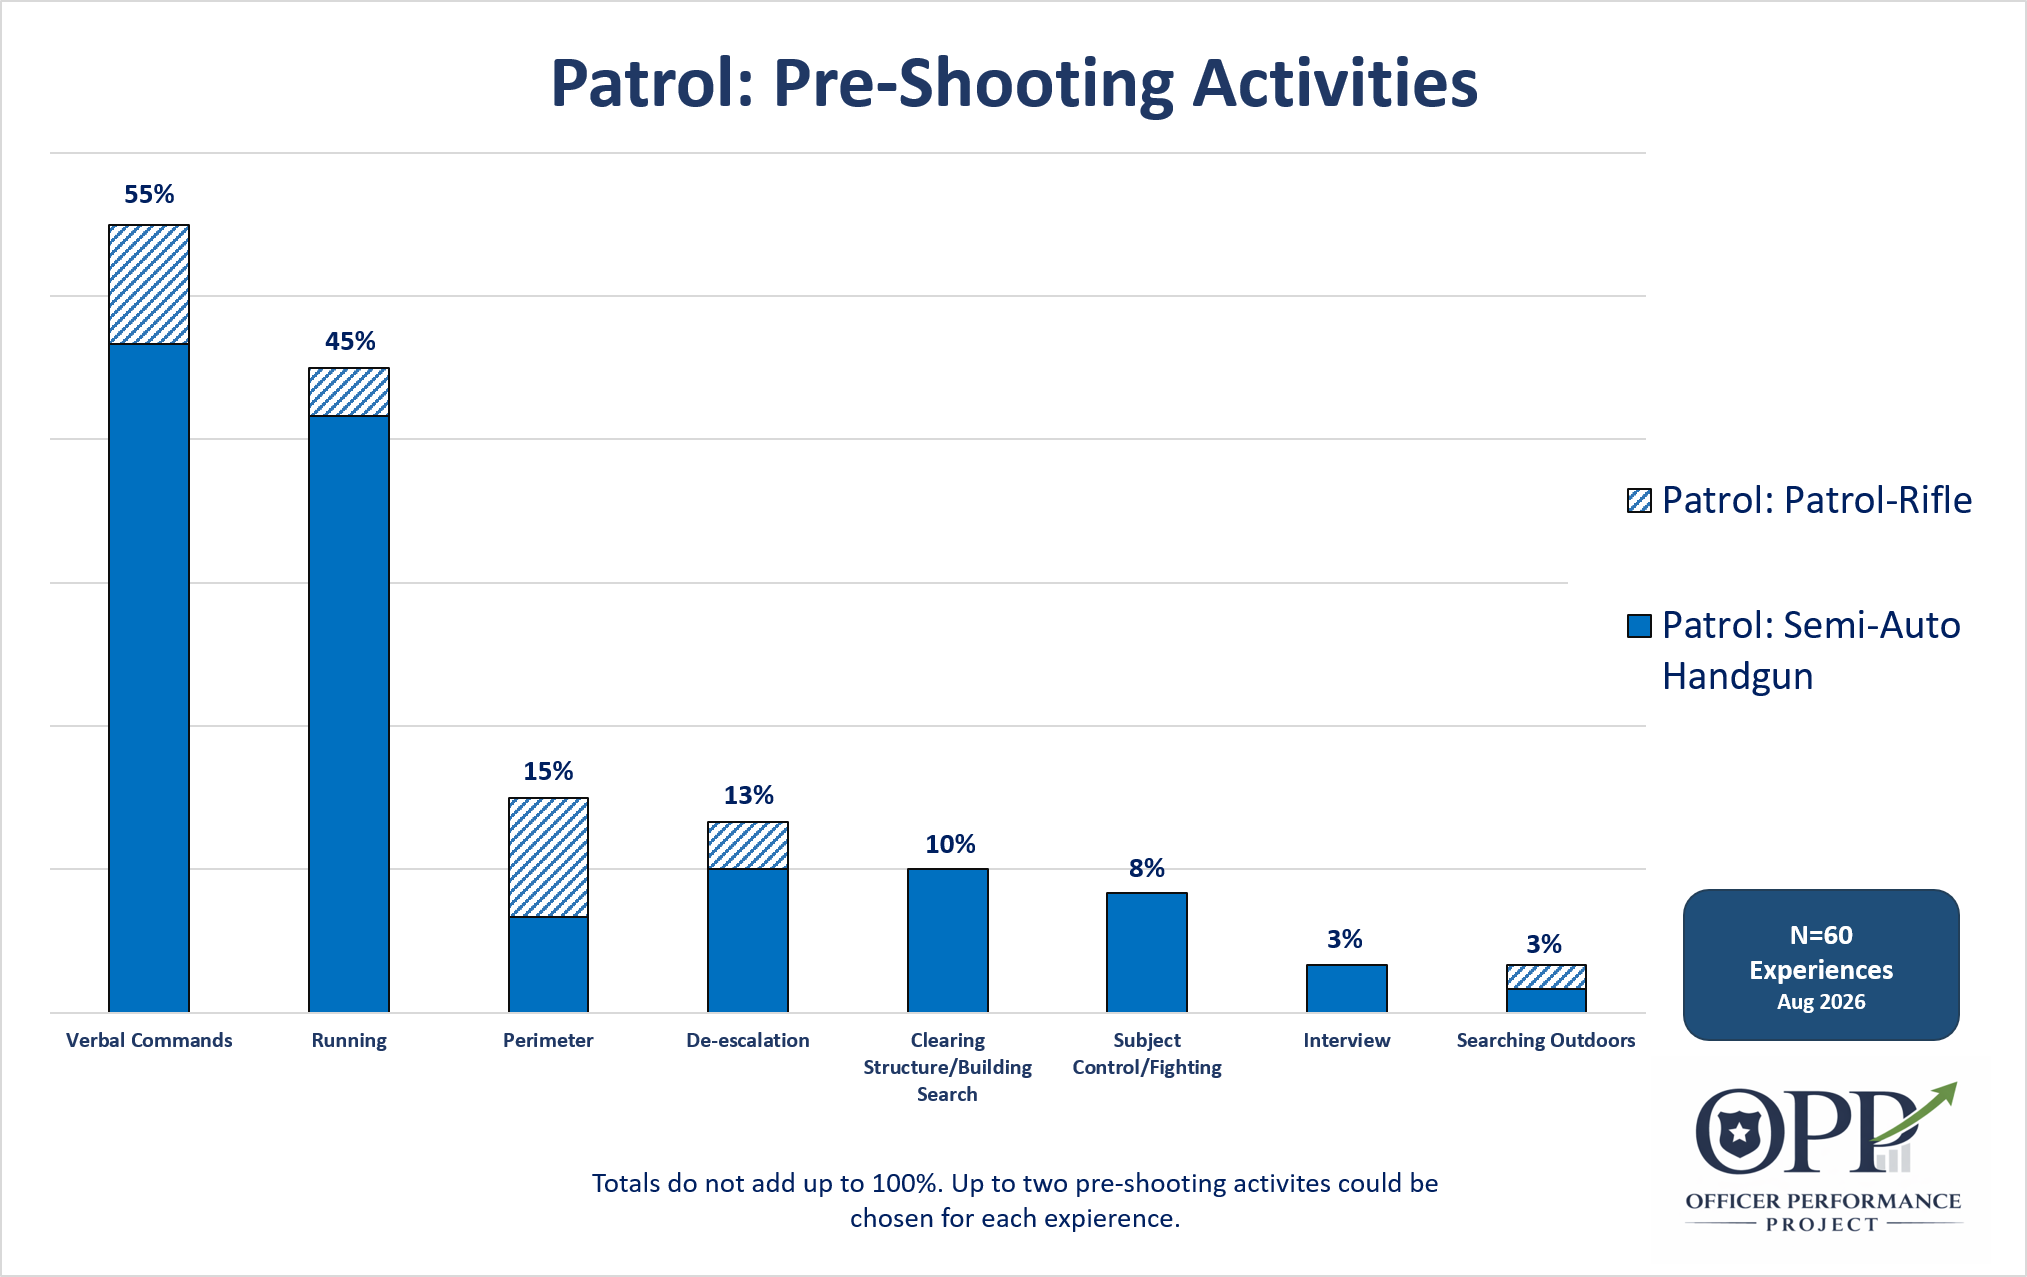
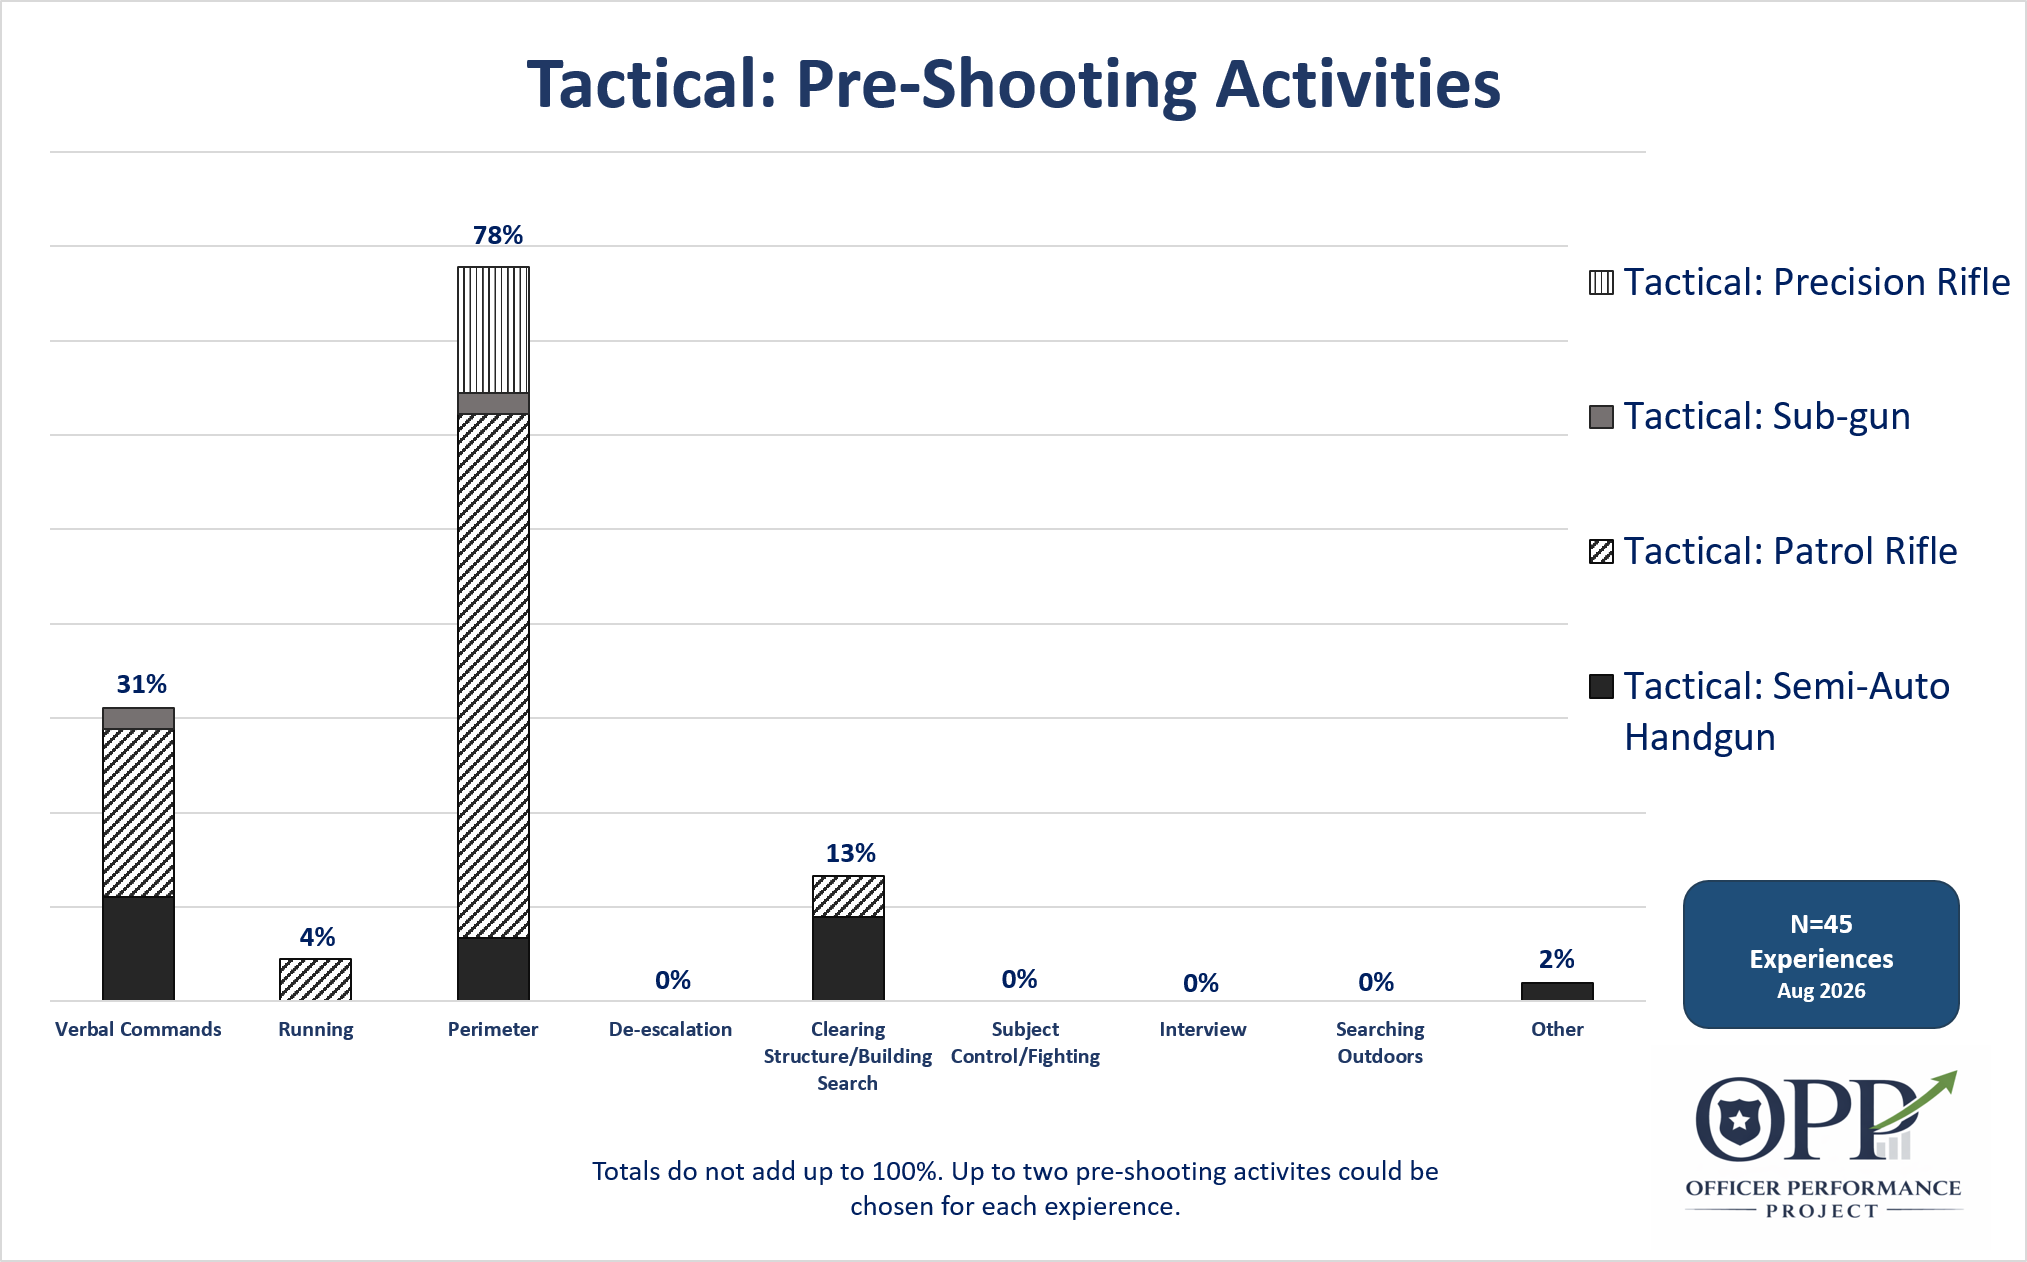
“Pre-shooting activities” covers what the officer was doing immediately before they fired shots. This is one of the most important data points and goes right to the core of providing realistic training. The database broke “pre-shooting activities” into several categories based on training relevance. For example, clearing buildings is a very different skill than physically controlling a resisting subject, which is also very different than verbal de-escalation. However, all three of those skills could be tested during a single OIS. And an officer’s competence with those skills could affect the outcome of the shooting, or even if a shooting occurred at all.
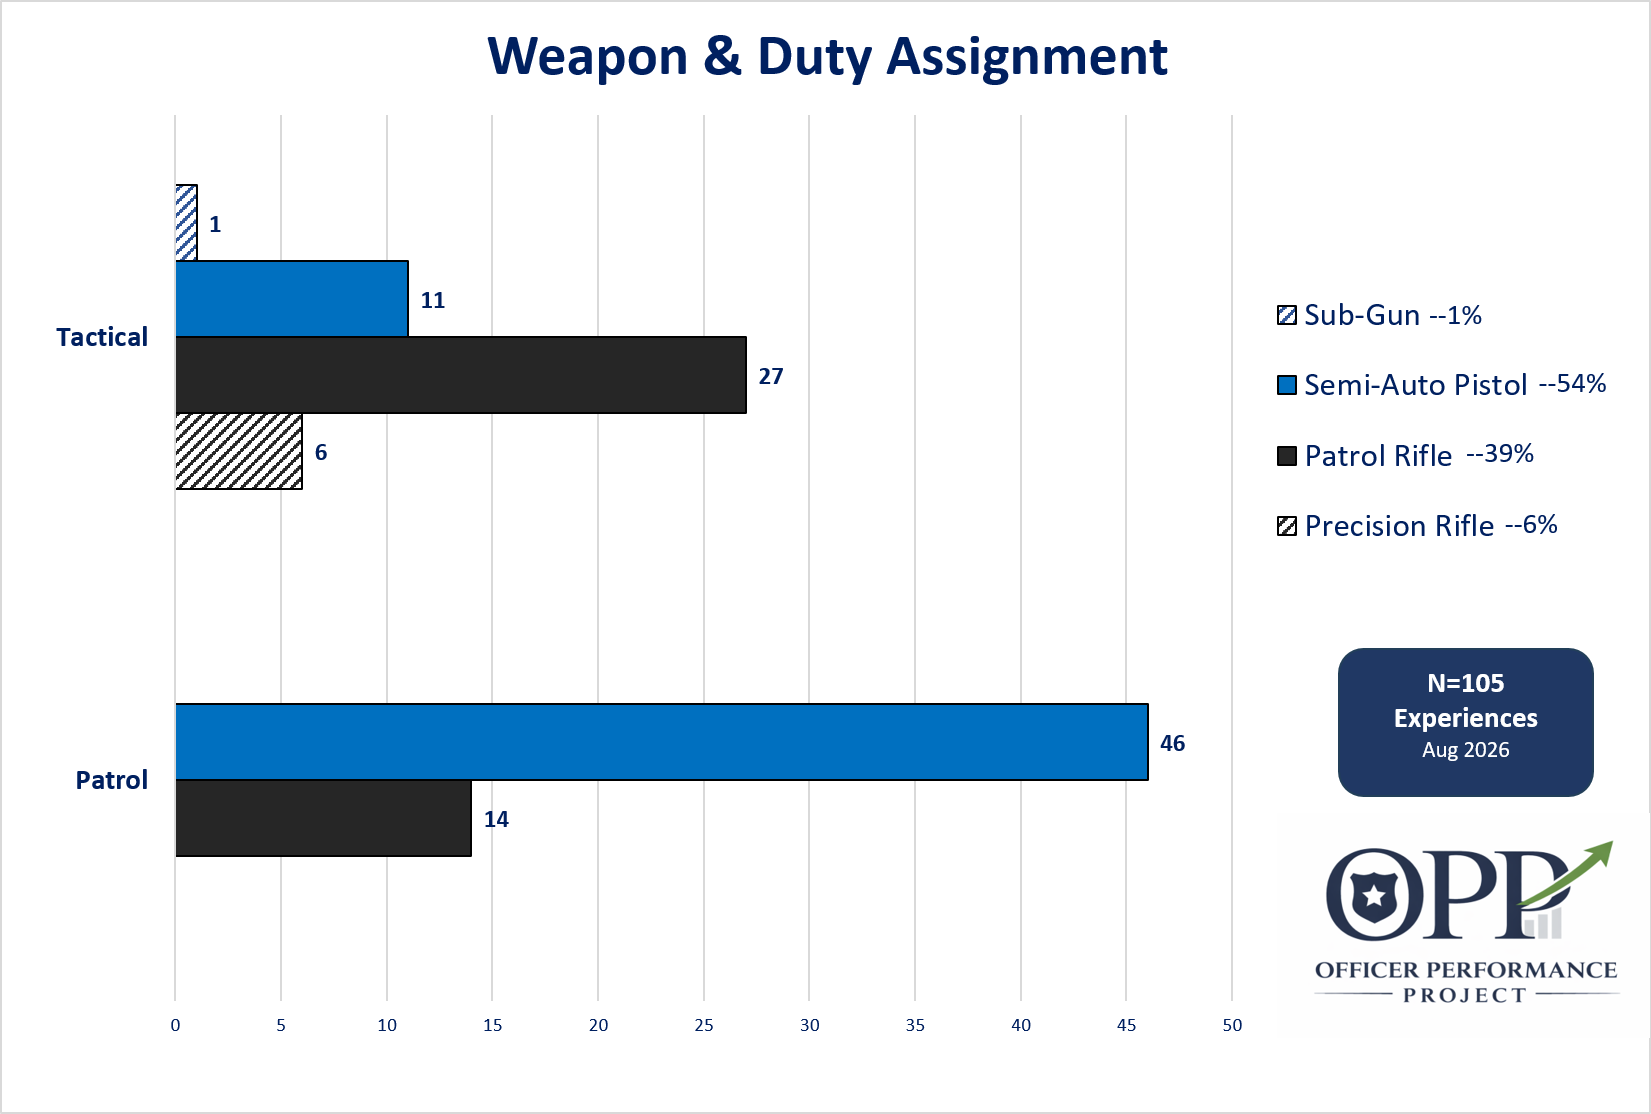
For data analysis, it is always easier if you are looking at a single variable. Dynamic incidents such as OIS’s are rarely so easy. For this study the two most relevant pre-shooting activities were chosen for the officer who fired shots. The charts’ shows the pre-shooting activities for the 105 Patrol and Tactical officers in the dataset broken down by duty assignment and weapon. Because more than one pre-shooting activity could be used in the study, the percentages do not add up to 100%.
“Verbal commands” was the most common pre-shooting activity for Patrol officers. “Perimeter”—or holding a position to prevent the subject from escaping—was the most common pre-shooting activity for tactical officers. Patrol officer ran prior to shooting in almost half of their experiences.
It is worth noting, the “pre-shooting” activity covers up to two of the most relevant activities of the officer who fired shots. Another officer who did not fire shots during an incident may have attempted de-escalation or been physically fighting for with the subject prior to the shooting. The database did not capture this information. For more information on how the activities were defined and how the data was collected please refer to “Methodology & Misc.”
-
Patrol Officers used their duty pistol in 70% of their experiences. Tactical officers used patrol rifles in 60% of their experiences.
Although no shotguns or revolvers were used in the data set, the database is setup to capture this information.
-
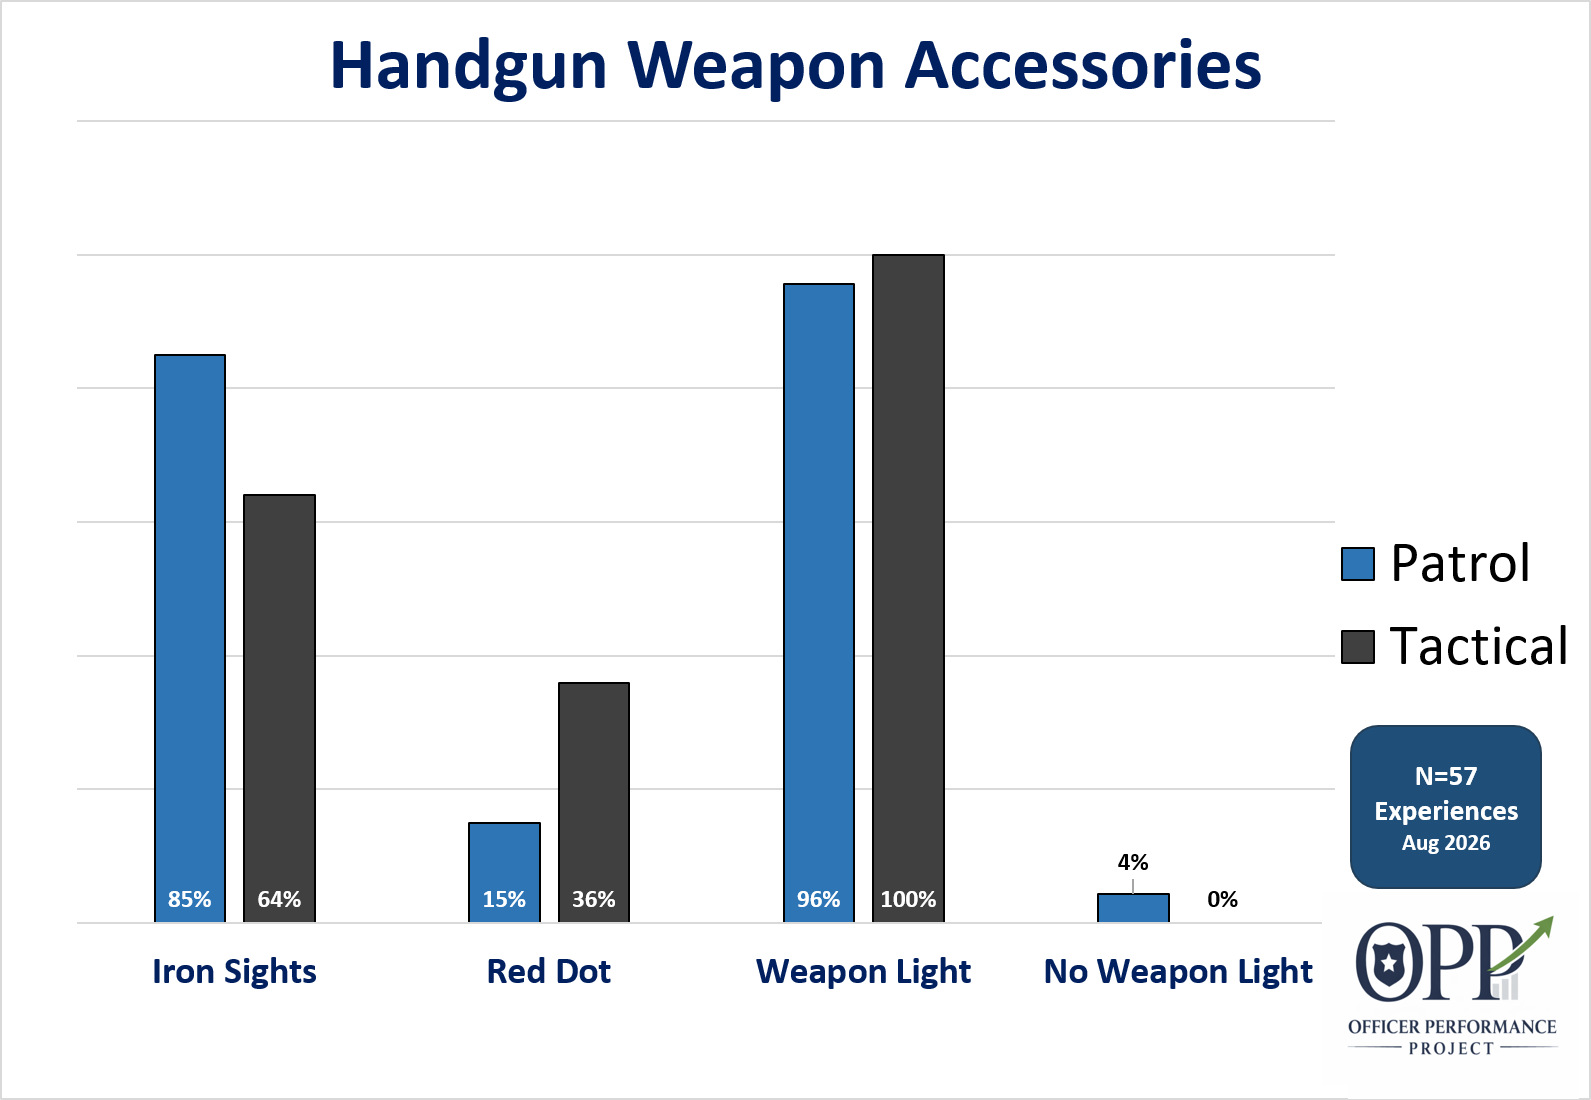
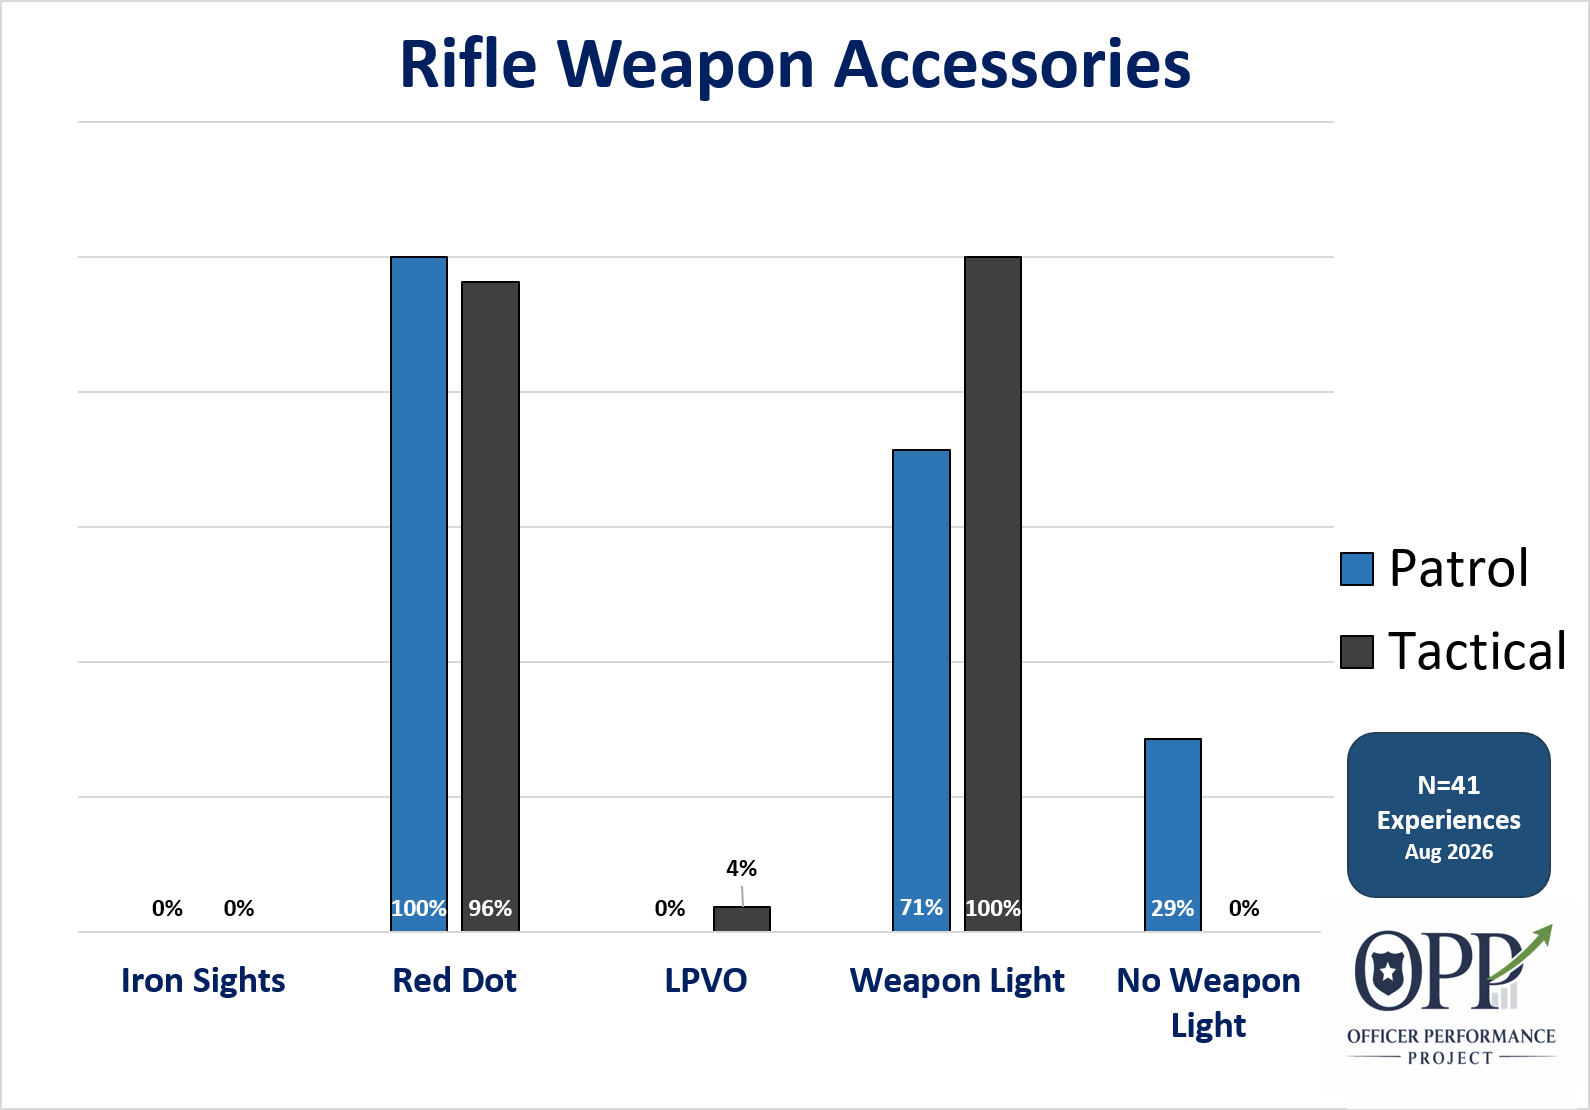
The charts on the right break down weapon accessories by duty assignment. 36% of tactical officers had red dot sights on their handguns while only 15% of patrol officers did. It is worth noting, the current data set involved incidents spanning from 2020 to 2025.
Weapon mounted handgun flashlights were common for all duty assignments.
-
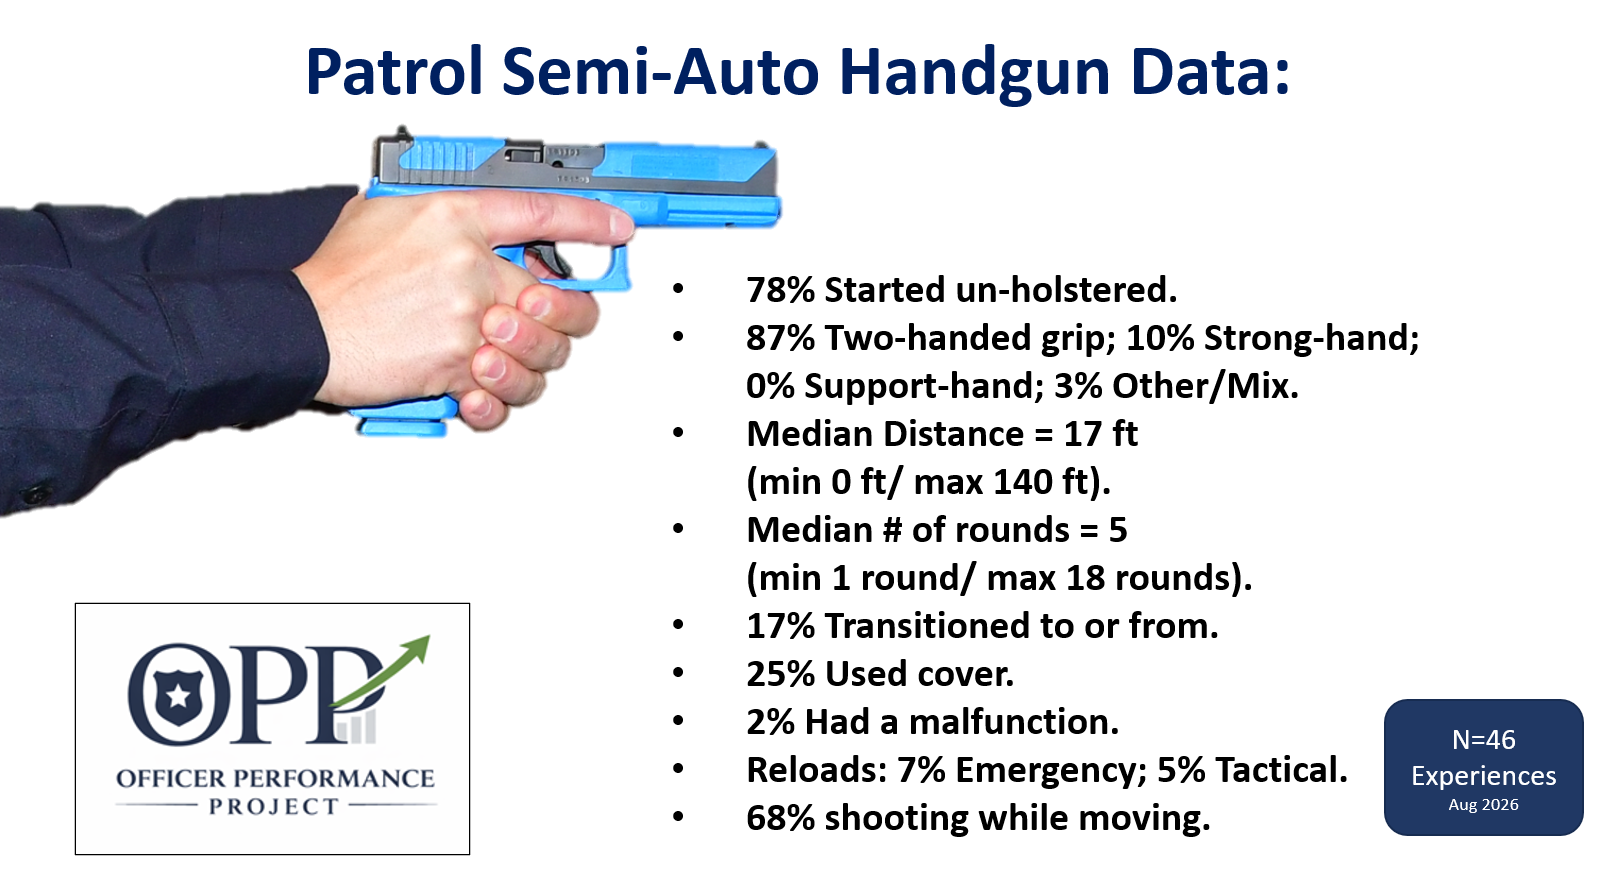
The following bullet points provide additional information to the graphic concerning the 46 Patrol officers (77% of the Patrol dataset) who used their handguns.
In 78% of the OIS’s where an officer used their handgun, the officer already had their weapon unholstered prior to the shooting. The officer’s weapon was usually already pointed at the subject, but may have also been a “carry” position such as low ready or sul. For 17% of the experiences, the officers had to draw and immediately shoot. For 1 incident (3%), the officer’s had to pick-up their weapon from the ground during a struggle with a combative subject.
68% of the patrol officers fired their handgun while moving.
The median distance of the handgun OIS’s was 15 ft. 75% of the shootings were withing 22 ft. The furthest handgun rounds were fired when the subject was approximately 135 ft. away. OIS’s are dynamic events and for many of the incidents the subject and/or the officer were moving during the shooting. The above information used the average min/max for each officer. Please refer to “Methodology & Misc.” for more information on how distance was determined for each incident.
17% of officers transitioned to or from a Taser or other and used their handgun during the incident. For this dataset, no officers transitioned to or from a rifle.
One officer (3%) had a malfunction with their handgun that they were able to clear during the incident.
-
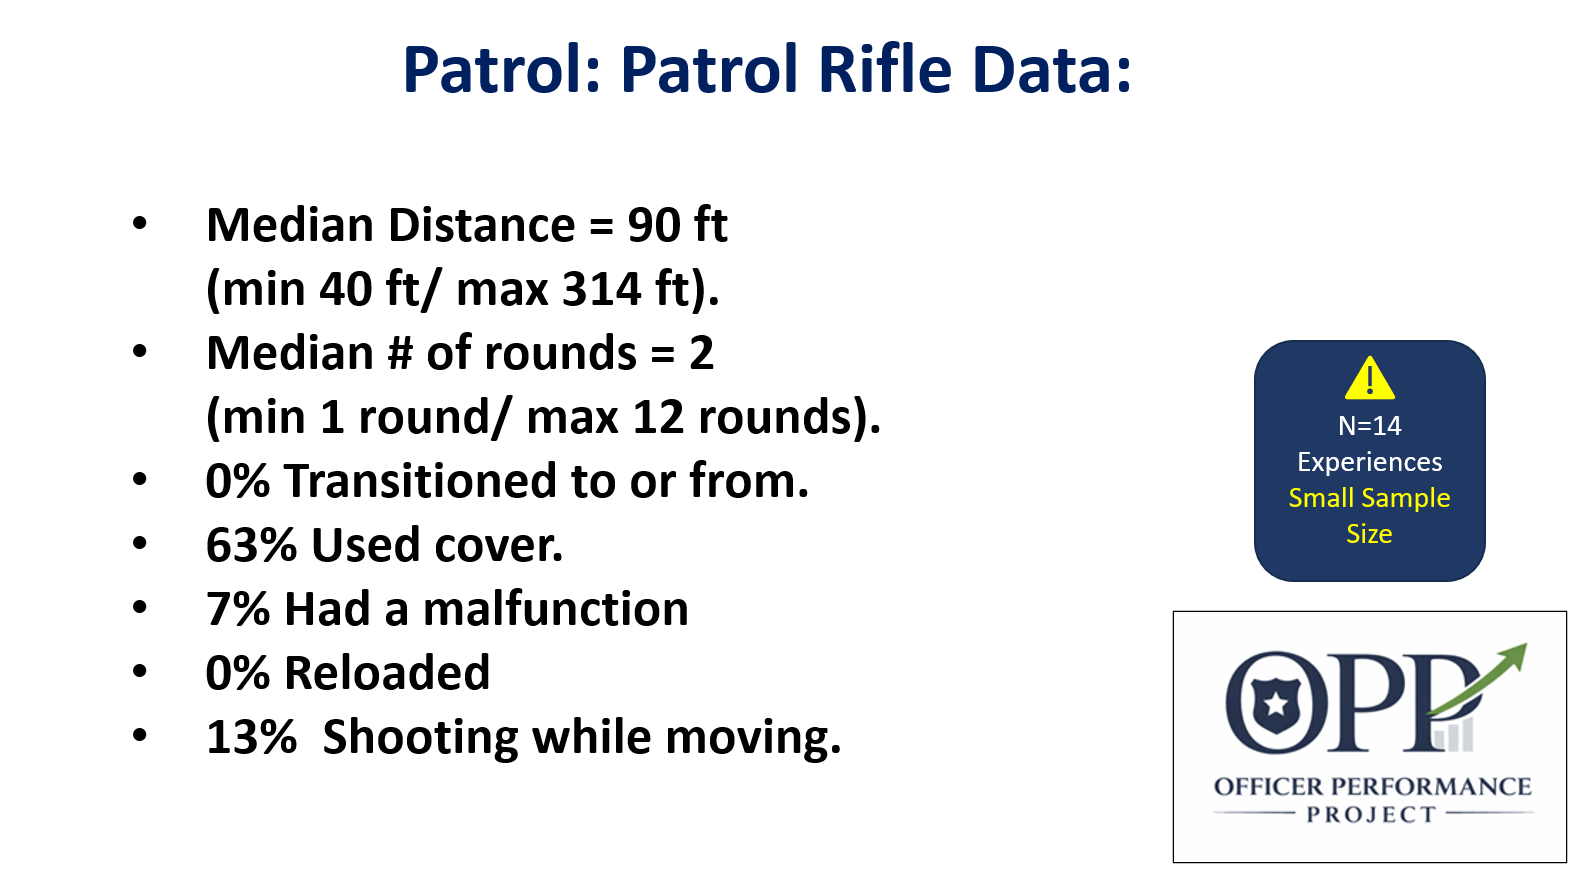
The following bullet points provide additional information to the graphic concerning the 14 officers (23% of the Patrol dataset) who used their rifles. Viewers should use caution drawing conclusions from this small dataset.
The median rifle distance was 90 ft. The furthest rifle shot was 314 ft. There were several rifle uses where the range was unknown.
No one using a rifle transition to a handgun or other, less-lethal weapon in the dataset.
Only 13% of Patrol officers shot their rifles while on the move.
Officers using a rifle were more than twice as likely to also use cover.
One officer in the dataset had a malfunction with their rifle.
-
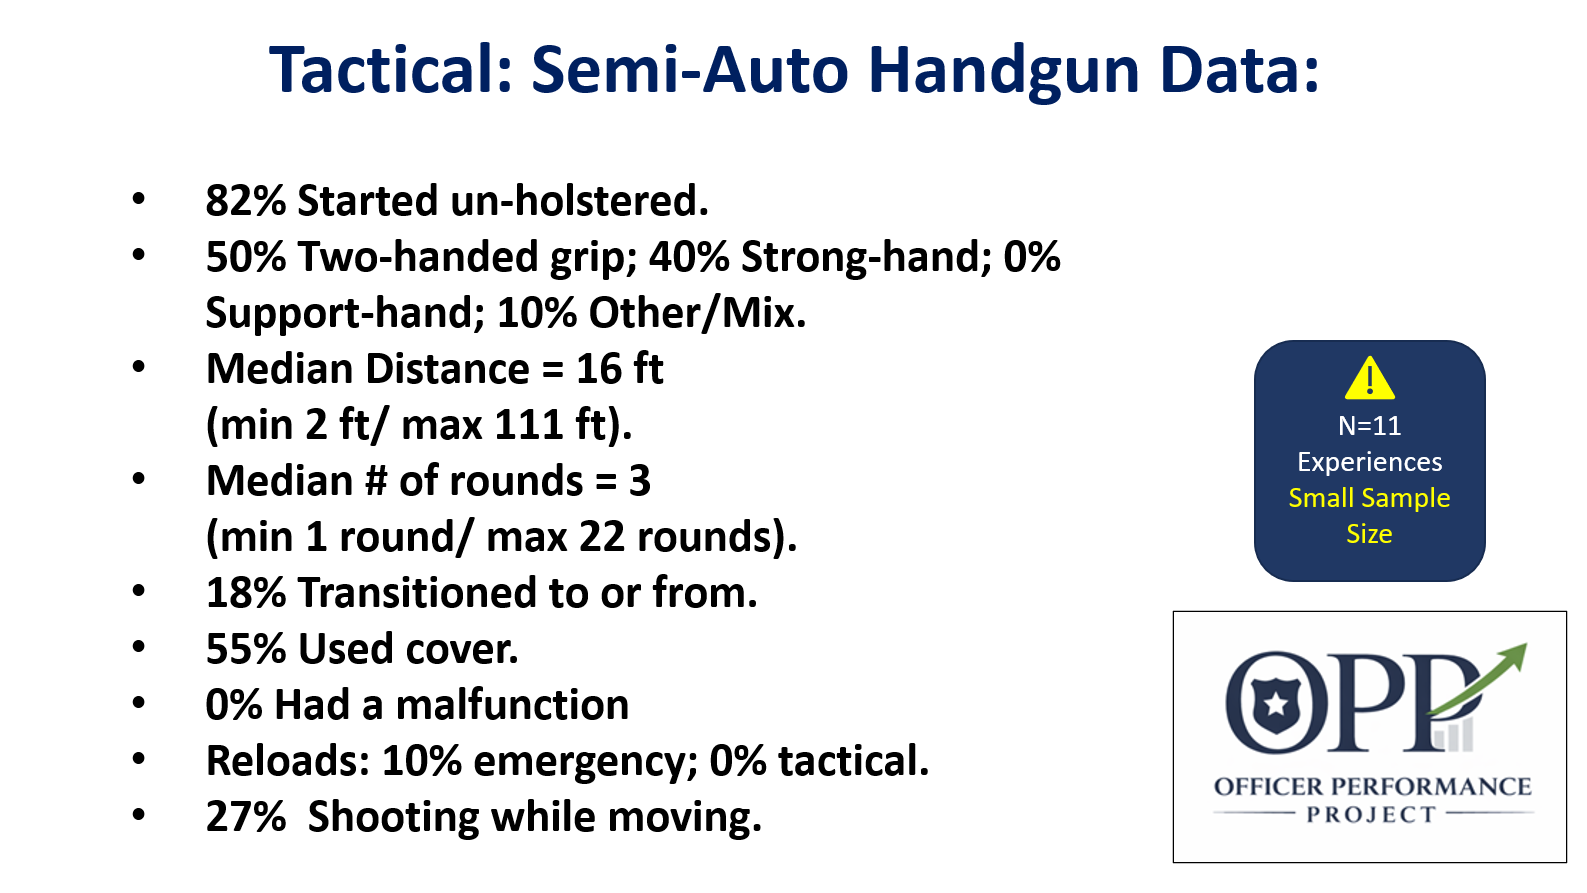
The following bullet points provide additional information to the graphic concerning the 11 Tactical officers (24% of the Tactical dataset) who used their handguns. Viewers should use caution drawing conclusions from this small dataset.
82% of the already had their weapon unholstered prior to the shooting. The officer’s weapon was usually already pointed at the subject, but may have also been a “carry” position such as low ready or sul.
27% of the Tactical officers fired their handgun while moving.
The median distance of the handgun OIS’s was 16 ft. The furthest handgun rounds were fired when the subject was approximately 111 ft. away. OIS’s are dynamic events and for many of the incidents the subject and/or the officer were moving during the shooting. The above information used the average min/max for each officer. Please refer to “Methodology & Misc.” for more information on how distance was determined for each incident.
18% of officers transitioned to or from a Taser or other tool and used their handgun during the incident. For this dataset, no officers transitioned to or from a rifle.
No Tactical officers had a malfunction with their handgun.
-
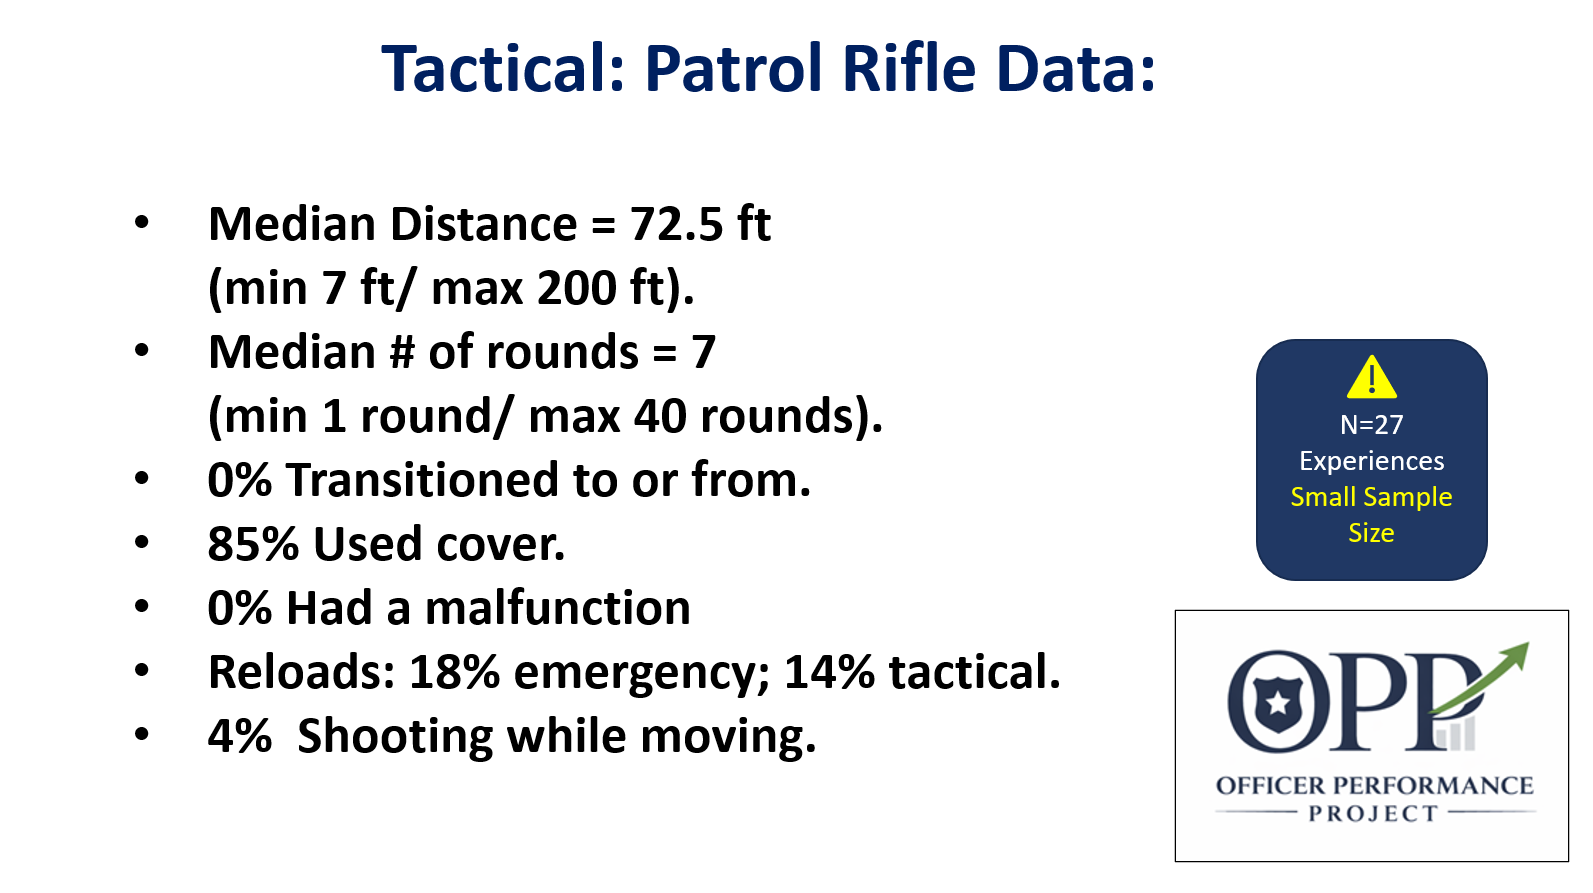
The following bullet points provide additional information to the graphic concerning the 72 officers (60% of the Tactical dataset) who used their rifles. Viewers should use caution drawing conclusions from this small dataset.
The median rifle distance was 72.5 ft. The furthest rifle shot was 200 ft.
No one using a rifle transition to a handgun or other, less-lethal weapon in the dataset.
Only 4% of Tactical officers shot their rifles while on the move.
Tactical Officers using a rifle used cover 85% of the time.
No tactical officers in the dataset had a malfunction with their rifle.
-
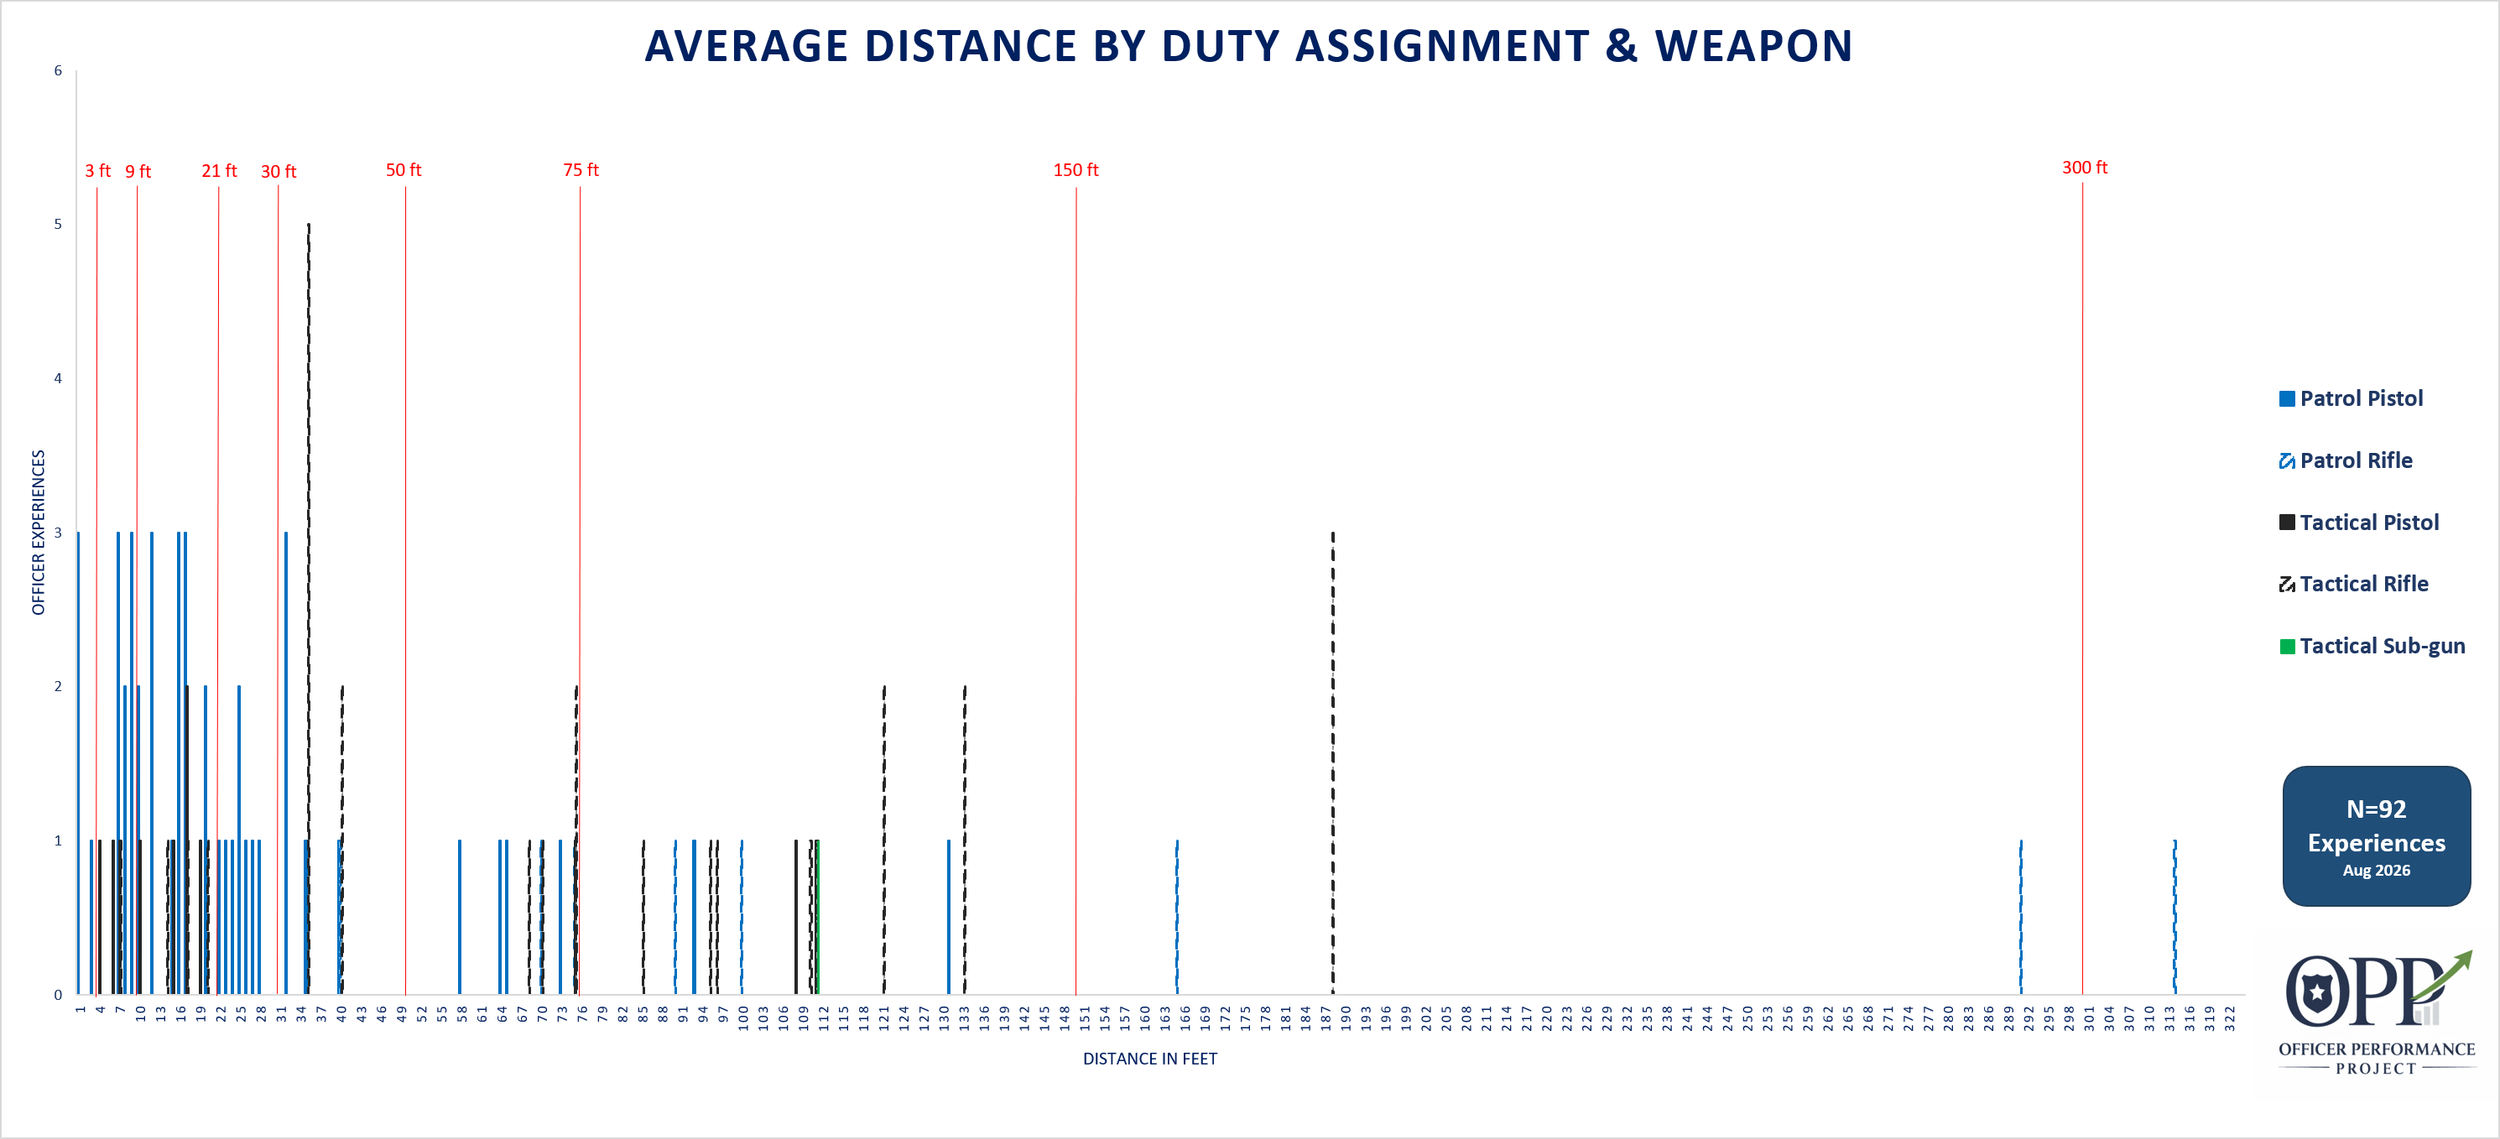
Researchers were able to determined the minimum and maximum distances for 98 of the officers who fired shots. The bullet points below and chart to the right provide more information on officer involved shooting distances broken down by duty assignment and weapon system.
Keep in mind, officer involved shootings are dynamic events and usually do not occur at one distance. The “average distance” for each experience is the midpoint between the minimum and the maximum distance for an officer.
The largest variation between the minimum and maximum was 112 ft.
The minimum and maximum ranges given below are not averages. They are the closest and furthest rounds fired by an officer in the dataset.
-
N=45 average distances.
Median distance 17 ft.
Average distance 25 ft.
Min range 0 ft.
Max Range 140 ft.
Common Qual Distances:
8.8% were 3 ft or less.
26.6% were 9 ft or less.
57.8% were 21 ft or less.
24.4% were 30 ft or more.
13.3% were 50 ft or more.
4.4% were 75 ft or more.
-
N=8 (small sample size)
Median range of 90 ft.
Average of 143 ft
Min range 40 ft.
Max range 314 ft.
Common Qual Distances:
0% were 3 ft or less.
0% were 9 ft or less.
0% were 21 ft or less.
87.5% were 30 ft or more.
75% were 75 ft or more.
37.5% were 150 ft or more.
12.5% were 300 ft or more
-
N=11 average distances.
Median of 16 ft.
Average of 35 ft.
Min range is 2 ft.
Max range 111 ft.
Common Qual Distances:
0% were 3 ft or less.
27.3% were 9 ft or less.
72.7% were 21 ft or less.
27.3% were 30 ft or more.
27.3% were 50 ft or more.
18.2% were 75 ft or more.
-
N=27
Median of 72.5.
Average is 80 ft.
Min range is 7 ft.
Max range is 200 ft.
Common Qual Distances:
0% were 3 ft or less.
3.7% were 9 ft or less.
14.8% were 21 ft or less.
85.2% were 30 ft or more.
51.9% were 75 ft or more.
11% were 150 ft or more.
0% were over 300 ft.
-
N=6
Median is 151 ft.
Average is 196 ft.
Min range is 87 ft.
Max range is 482 ft.
-
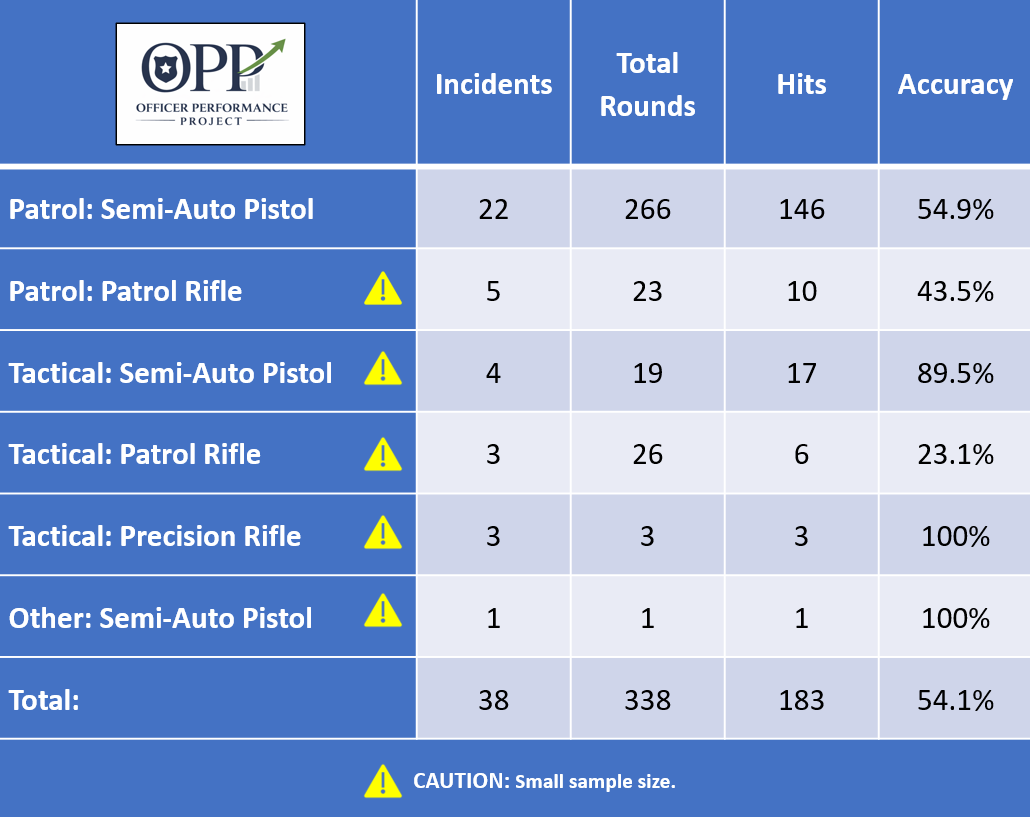
The table to the right breaks down the average accuracy by weapon and duty assignment. Accuracy was generally determined “by incident” and not “by officer.” In cases where multiple officers fired the same type of weapon it was not possible to determine who’s round hit the subject and who’s missed. Not every incident was suitable for analysis. In some Incidents the number of hits was not publicly available or multiple types of weapons were used. Additionally, there were two cases where “directed fire” was used in order to protect innocent life. These incidents were removed from the accuracy dataset.
Avoid overusing accuracy as the sole measure of performance. There are multiple reasons why an incident may have a lower accuracy percentage that are not related to the officer’s performance. Because the data primarily involved fatal shooting investigative reports, overall OIS accuracy is probably lower.The table to the right breaks down accuracy by weapon and duty assignment. Consumers of this data should be cautious when sample size is small.
-
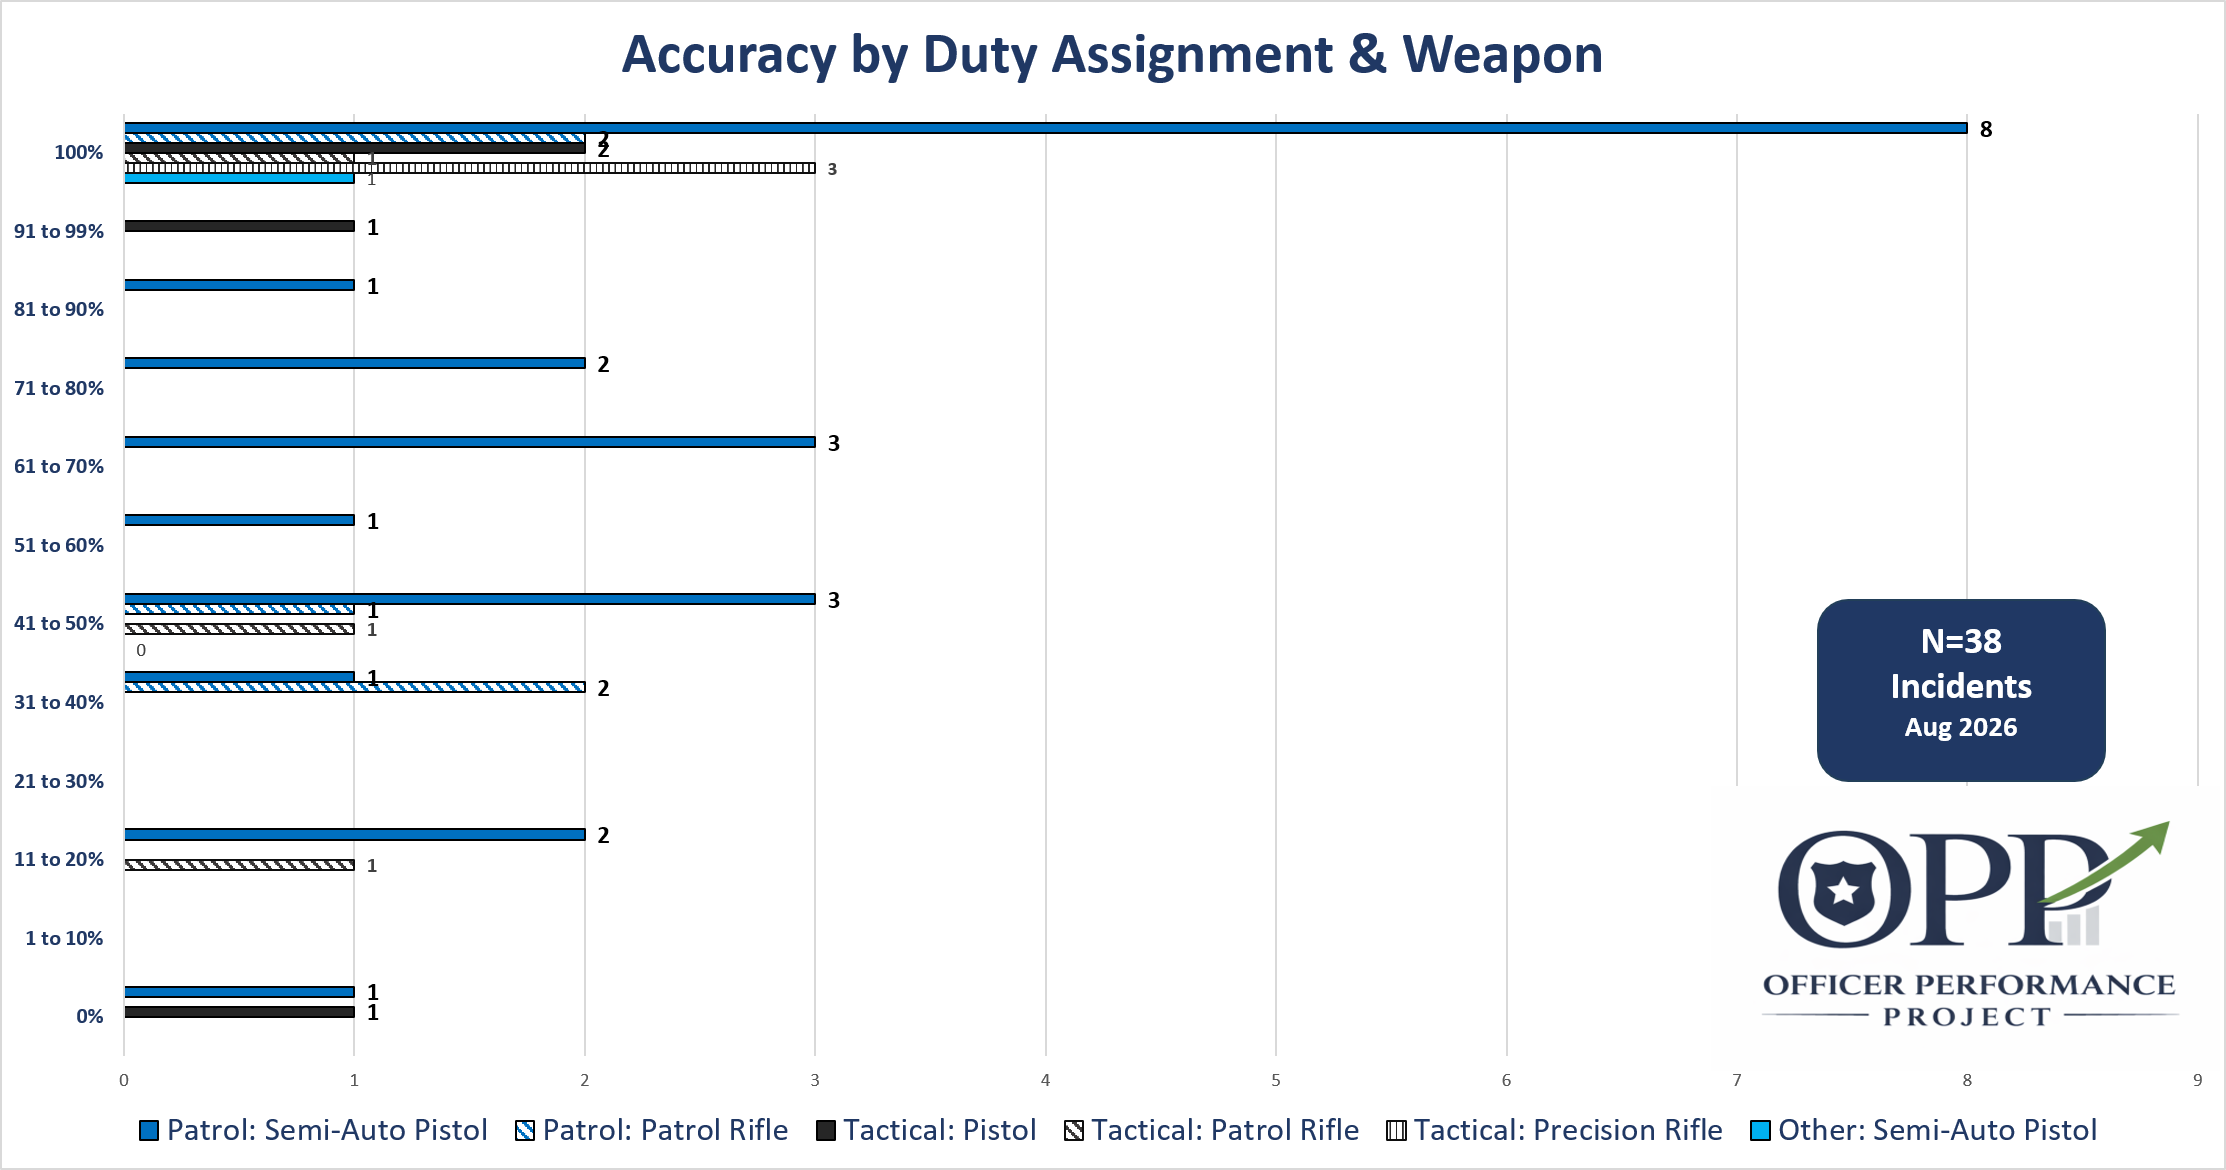
Another way to look at accuracy is by incident. The chart on the right counts the accuracy for each incident by duty assignment and weapon type. If an officer fired and hit with one round, and another officer fired five rounds and all five struck the suspect, both incidents would count as 100% accuracy.
When viewed this way, in over a third of the incidents when patrol officers used their handguns they had zero misses.
-
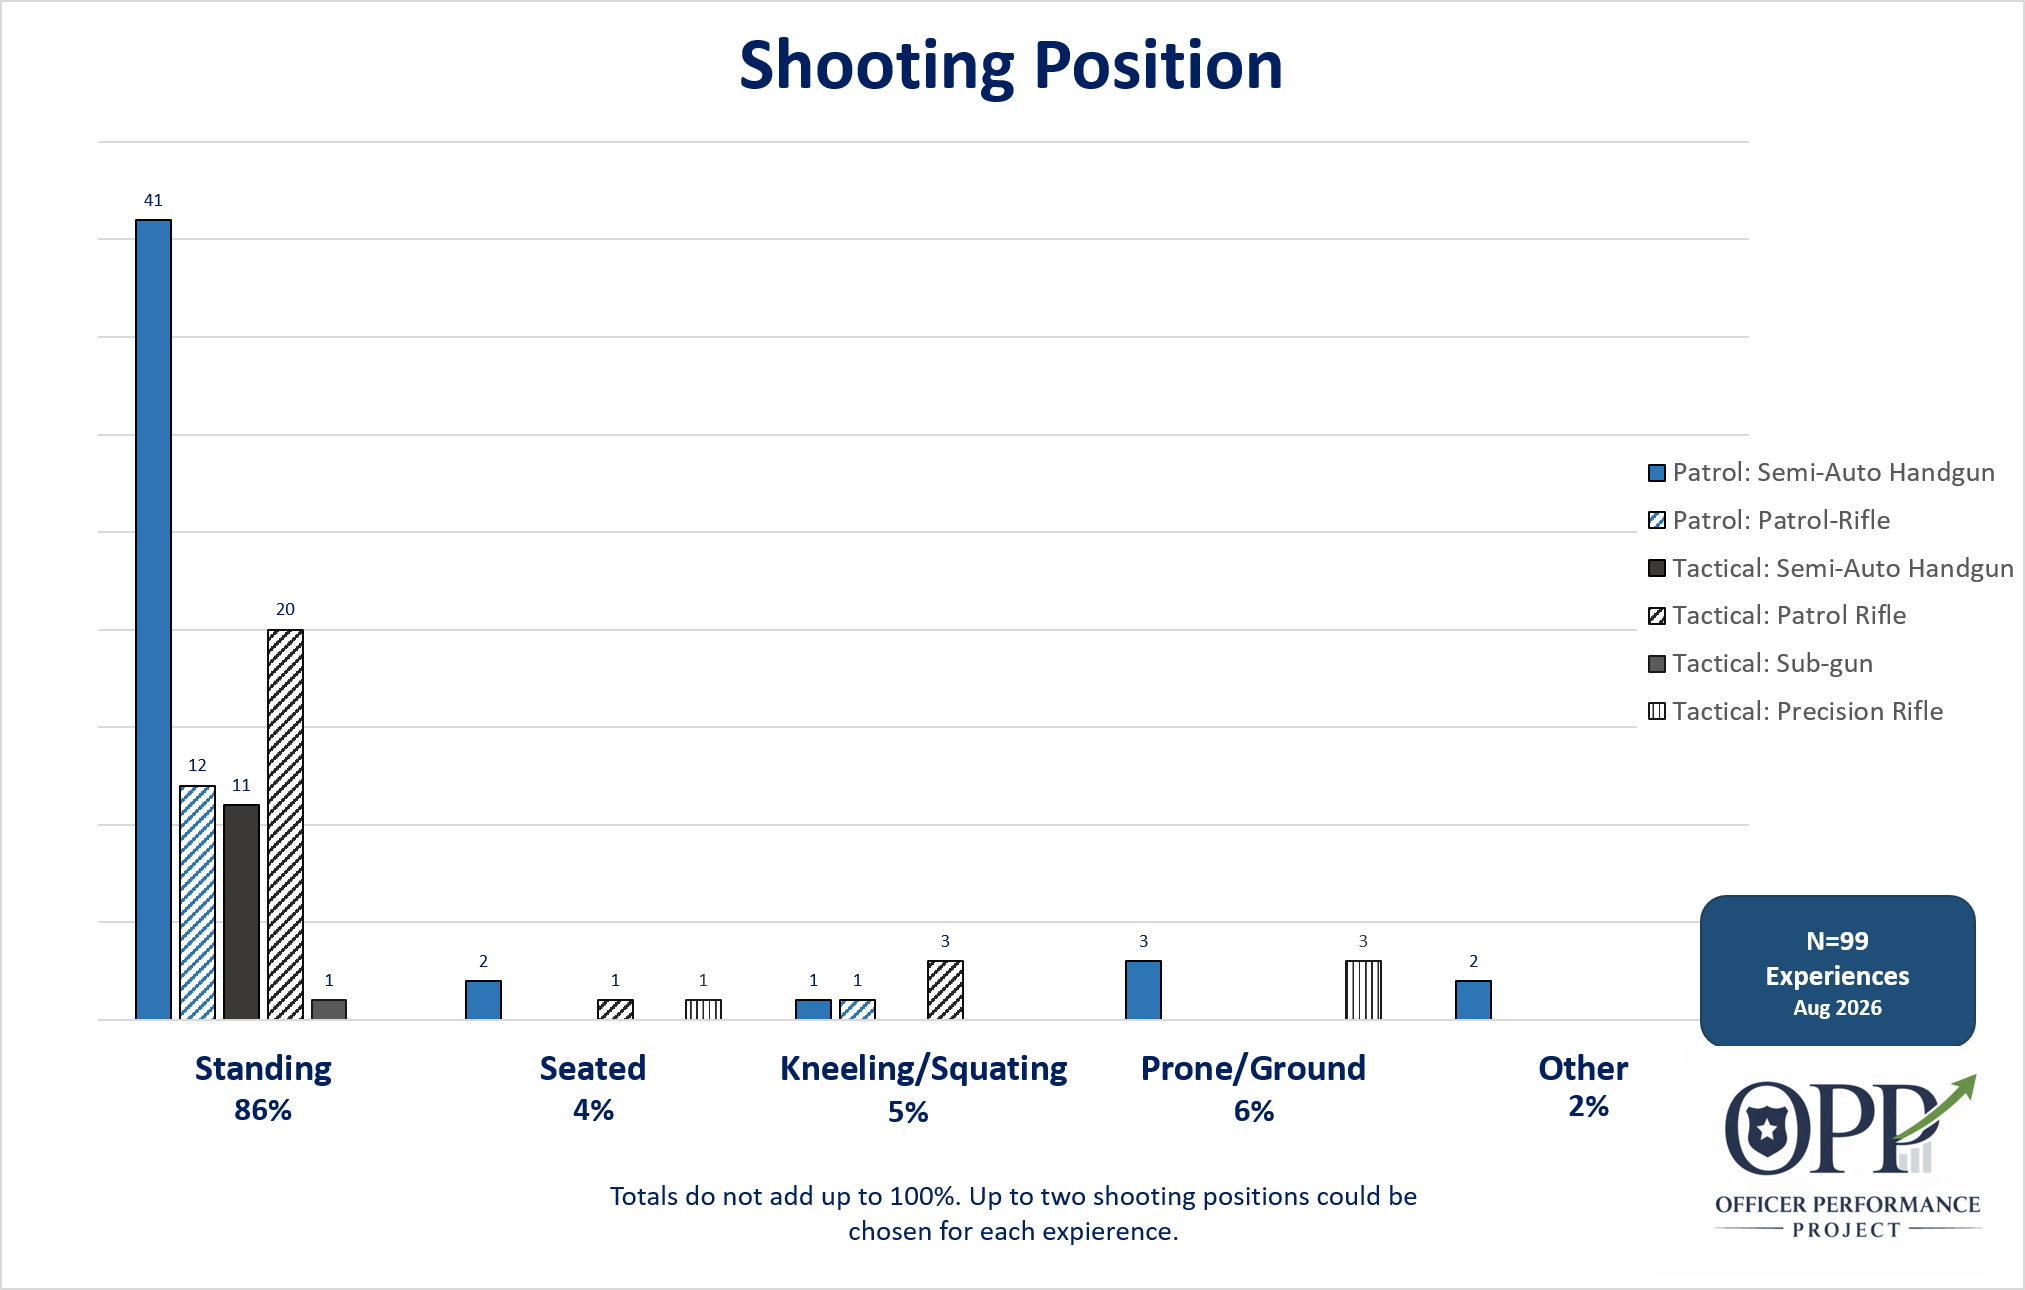
The shooting position for each officer who fired shots was recorded. Shootings incidents that were too dynamic to fit into one category were recorded as “other.”
The majority of officers fired from the standing position. Patrol officers showed more variety in their shooting positions than Tactical officers. Excluding snipers, Patrol officers were the only officers to shoot from the ground in this dataset. All of the shots fired from the ground by patrol officers were either because the officers fell or were involved in subject control.
-
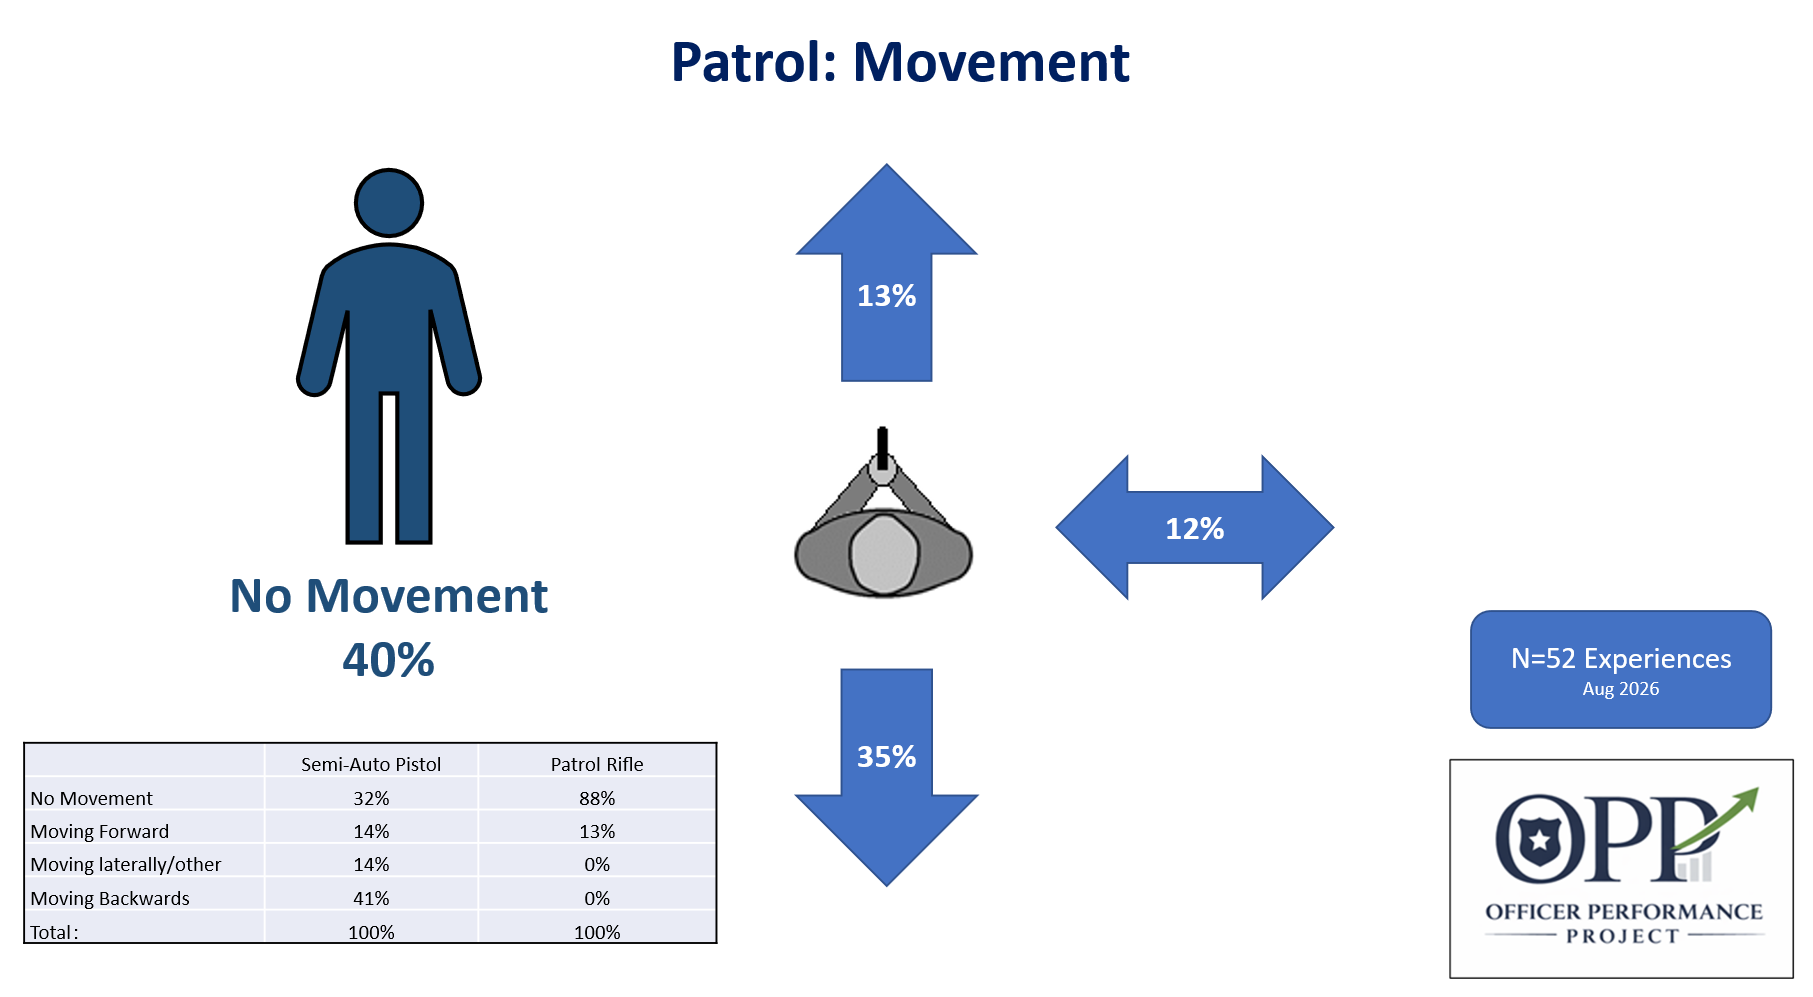
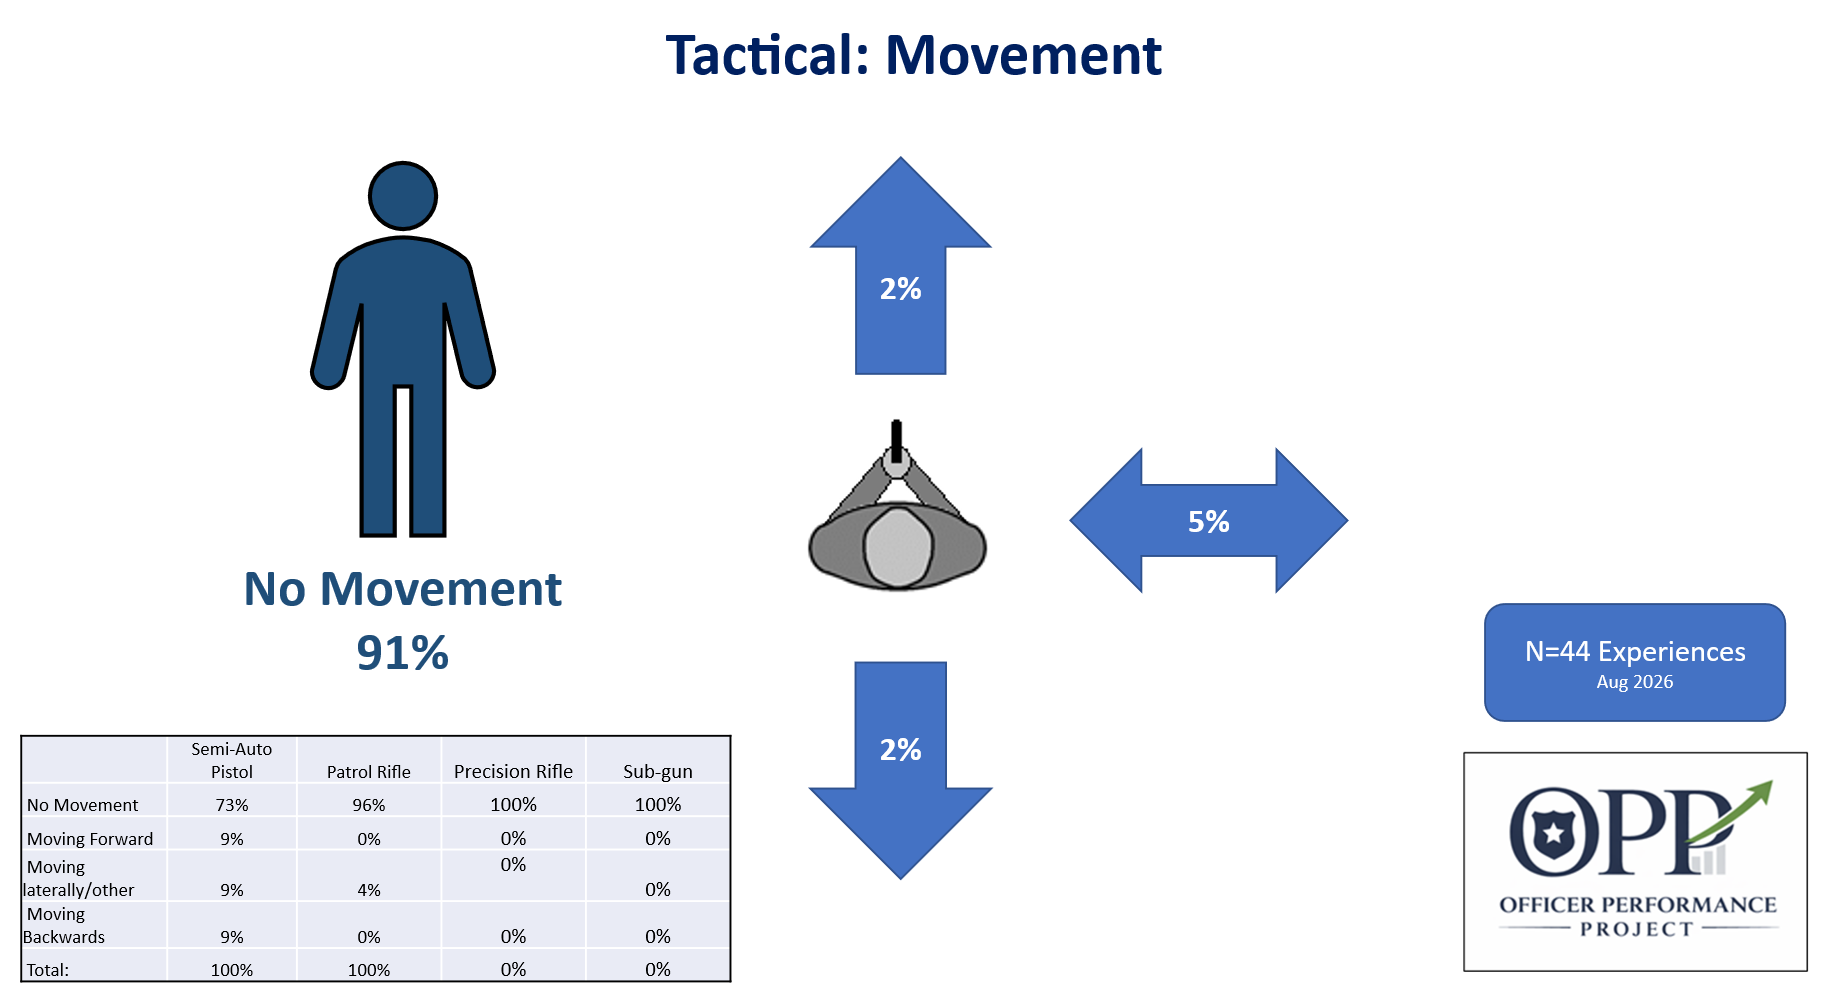
The OIS study looked at if the officer fired shots while moving or if they were stationary. This is frequently taught as “shooting on the move,” which is different than moving to a position, stopping, and then shooting.
There were 52 Patrol experiences and 44 Tactical experiences where the study was able to determine if the officer shot stationary, or while moving forward, backwards, or laterally. The study did not differentiate between left and right. Movement too dynamic to be neatly classified was combined was considered lateral movement. This dynamic movement usually involved subject control just prior to the officer shooting.
It is worth noting, when Patrol officers shoot on the move it is usually moving backwards (59% of movement). Tactical officers generally shot stationary while performing perimeter duties.
-
24% of the incidents involved the use of less-lethal weapons by officers. The officer using less-lethal may or may not have also fired shots.
38% of the incidents also involved a foot and/or vehicle pursuit.
31% of patrol officers who fired shots used cover.
9% of patrol officers conducted a reload (5% emergency/4% tactical).
3% of patrol officers had malfunction with their pistol, which they were able to clear.
As the sample size of the study get’s larger, the above percentages will likely change.
-
53% of the incidents involved the use of less-lethal weapons by officers. The officer using less-lethal may or may not have also fired shots.
77% of tactical officers who fired shots used cover.
23% of tactical officers conducted a reload (15% emergency/8% tactical).
0% of tactical officers had a malfunction.
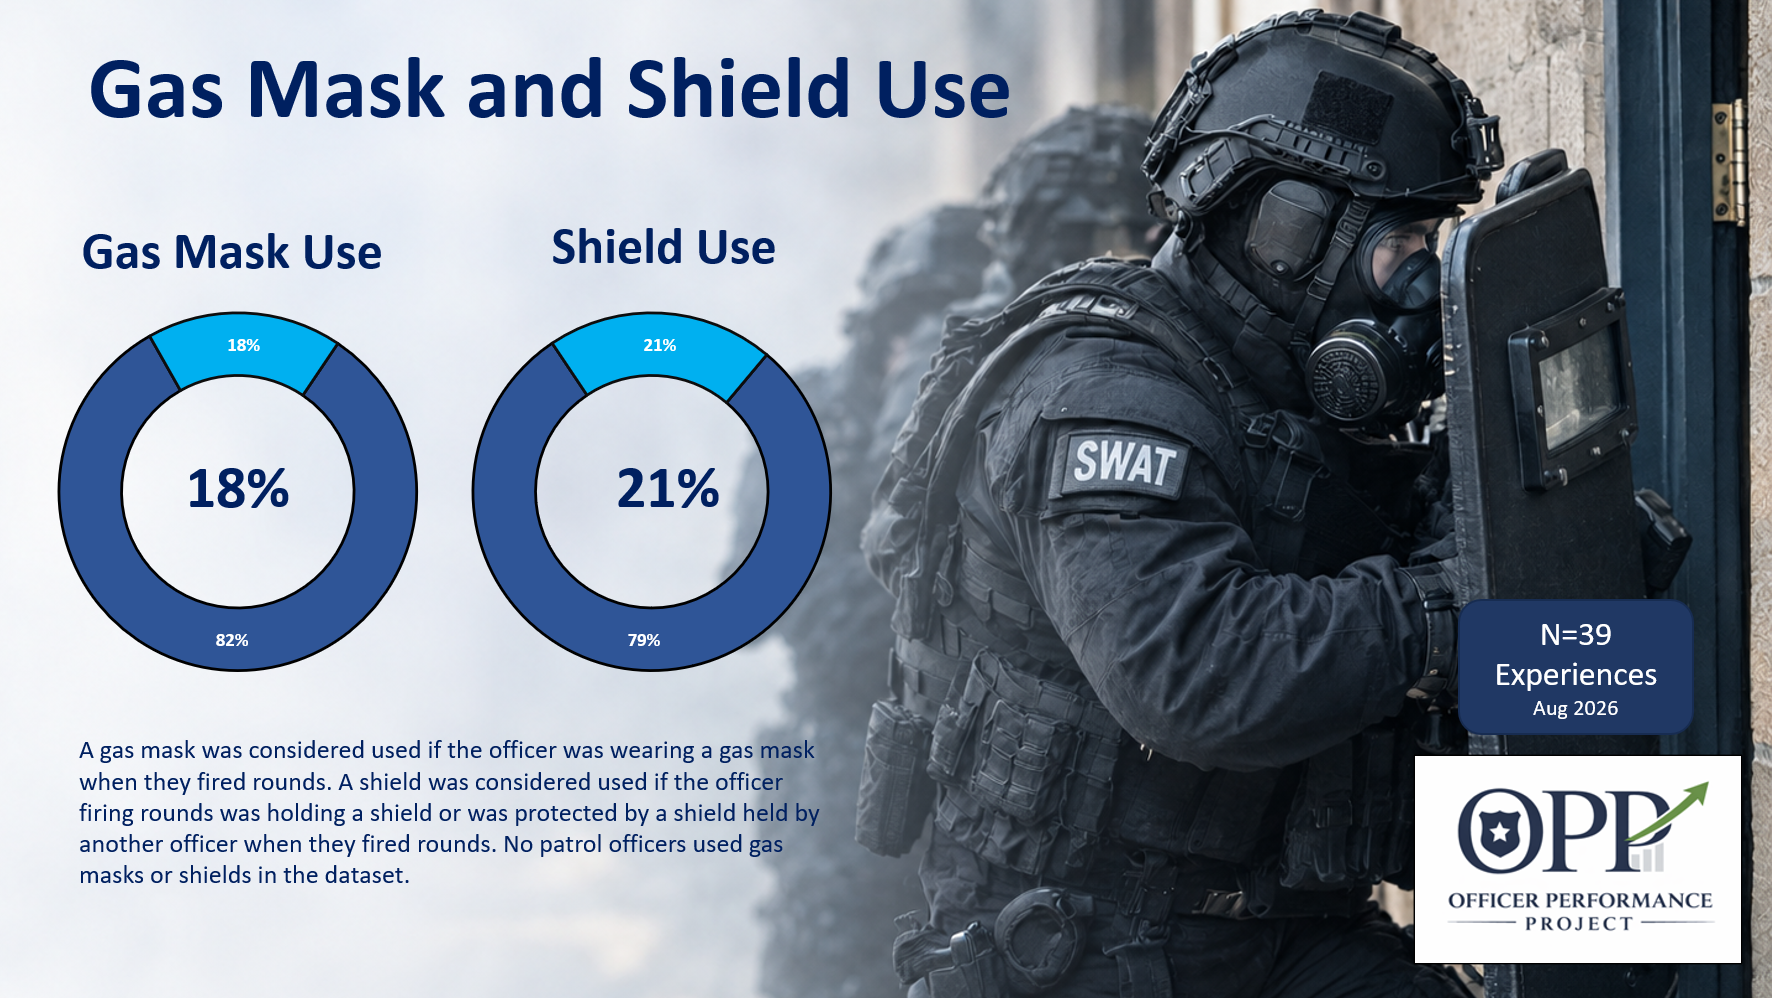
18% of tactical officers were wearing gas masks when they fired rounds.
21% of tactical officers were either holding a shield or protected by another officer holding a shield when they fired rounds.
As the sample size of the study get’s larger, the above percentages will likely change.