
-
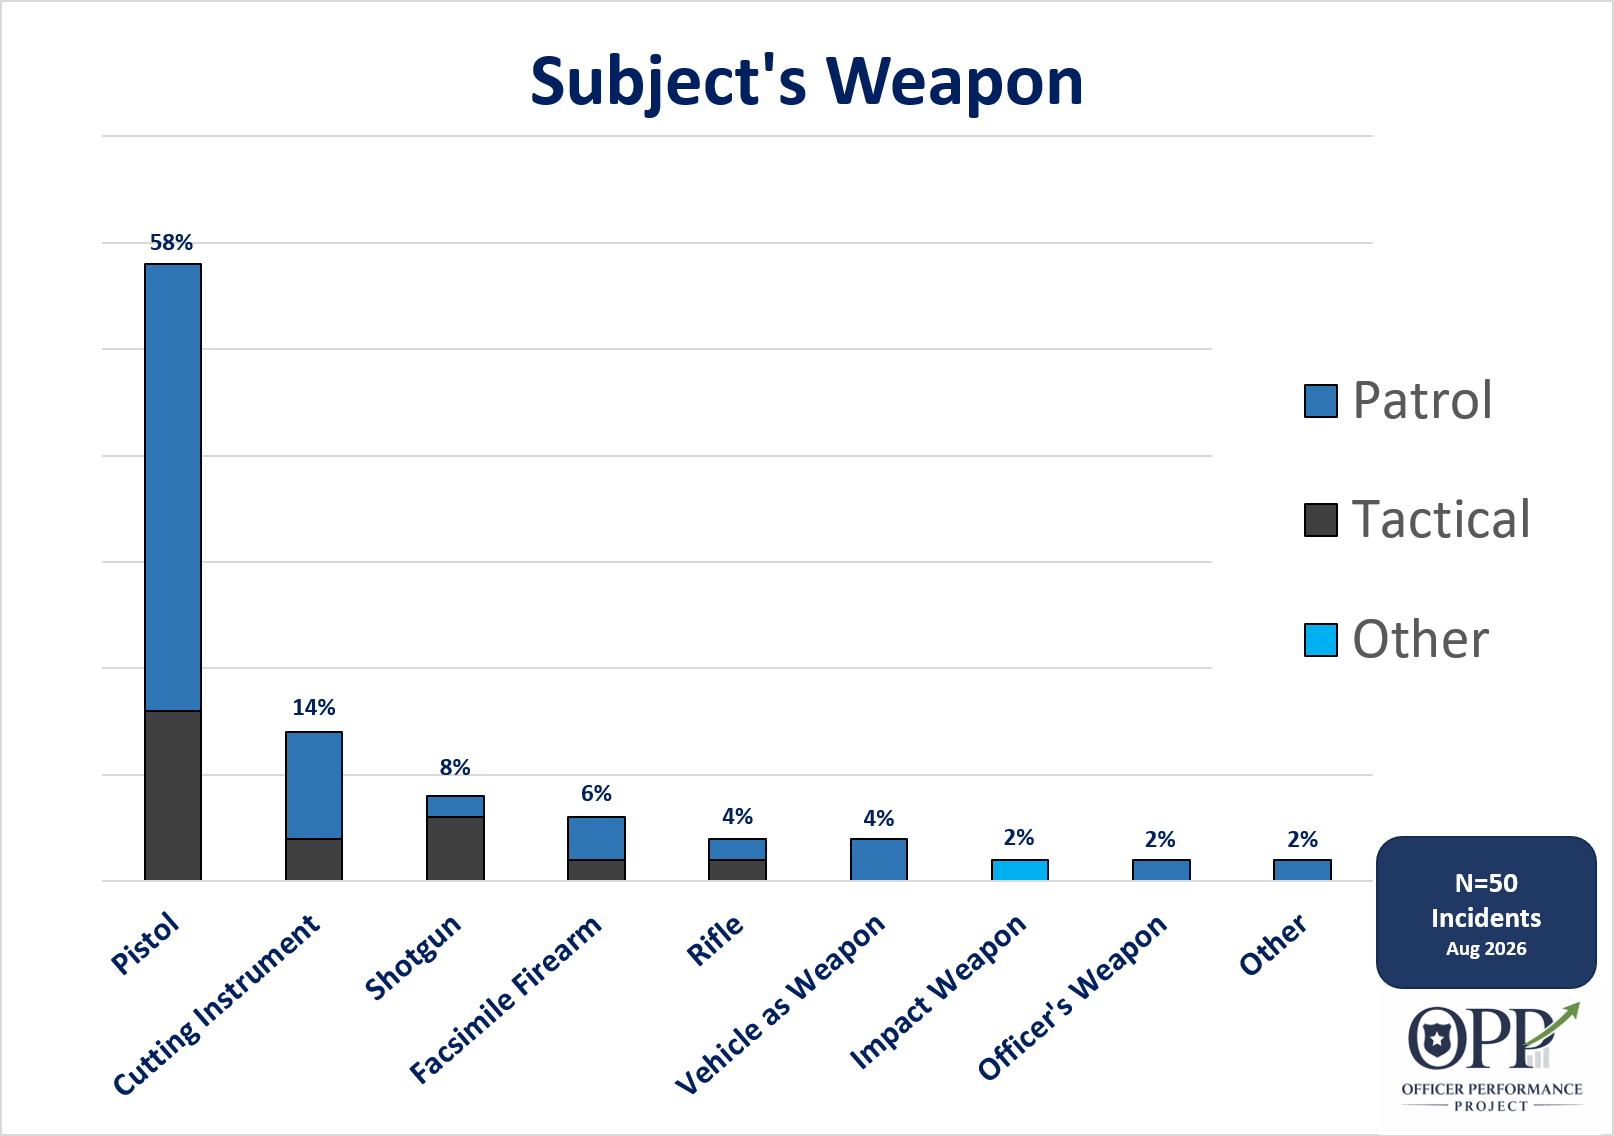
The study examined what weapon the subjects were armed with during the 50 incidents in the data set. For a weapon(s) to be considered, there had to some evidence the subject possessed or used the weapon in close proximity to the shooting other than officer’s belief at the moment they used force. Even if that belief was reasonable. Evidence included the weapon itself and/or video of the incident. 70% of the time, subjects were armed with a firearm during the incident.
Weapons later found during the investigation but not related to incident were not included. This could include weapons stored in the subject’s home or vehicle but not accessed by the subject.
“Facsimile Firearms” in this data set included airsoft weapons and BB guns used by adults in a threatening manner towards police.
There were 7 incidents (14%) where the subject possessed more than one firearm. In these cases, either the primary firearm used, or the most dangerous firearm used was chosen based on the circumstances.
-
When the subject had a firearm:
45% of the subjects fired rounds during the encounter.
Of the subjects who fired rounds during the encounter, 59% of the subjects shot before officers returned fire. For several incidents, researchers were unable to determine who fired first based on the investigative file.
10% of the subjects had a malfunction they were not able to clear.
No subjects were wearing body armor in this data set.
1 subject from the dataset reloaded during the incident.
In 4 incidents, officers were shot by the suspect.
-
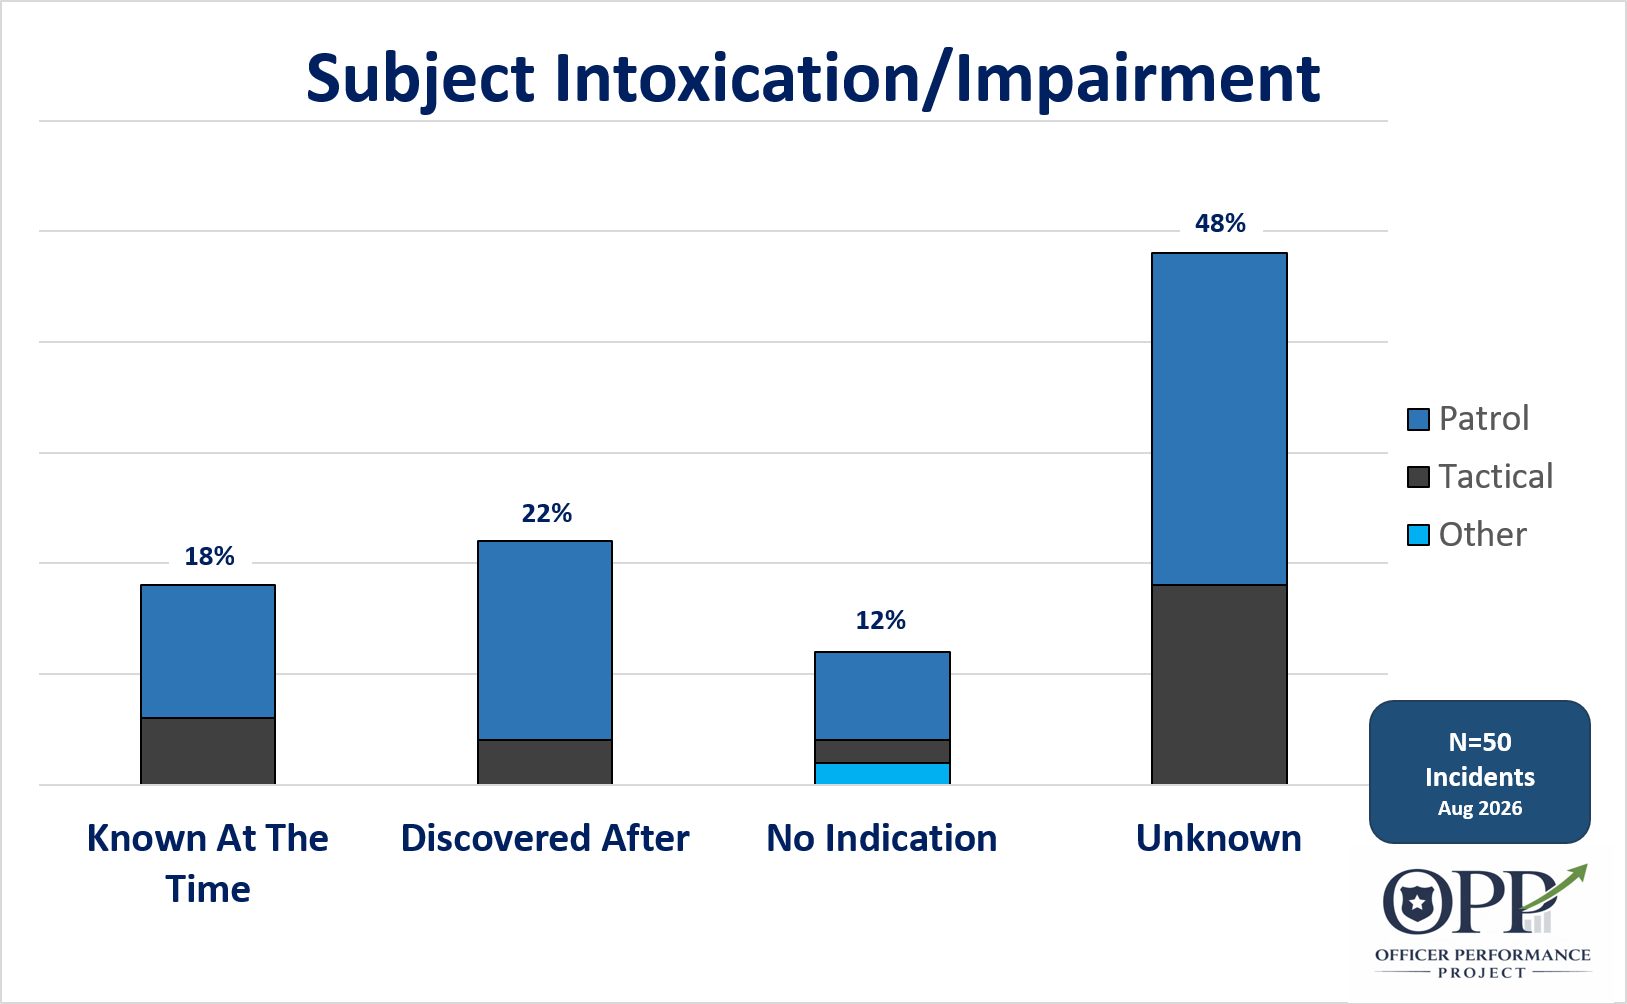
The study attempted to determine from the investigative documents if the subject was intoxicated or impaired at the time of the shooting. In almost half of the incidents the impairment status of the subject was “unknown,” frequently because toxicology portions of the autopsy were redacted and there was no additional information to support a finding. Greater access to the unredacted investigative files would give a clearer picture of how often the subject’s intoxication/impairment plays a role in officer involved shootings.
If you remove the “unknown” incidents from the chart to the right, it is interesting to note that patrol officered faced an impaired subject 80% of the time (15 out of 19 incidents), but only knew the subject was impaired 32% of the time (6 out of 19 incidents). As the sample size of the OIS project grows, the findings will become more robust.
More information on how intoxication/impairment was determined is available at the “Misc. & Methodology” page.
-
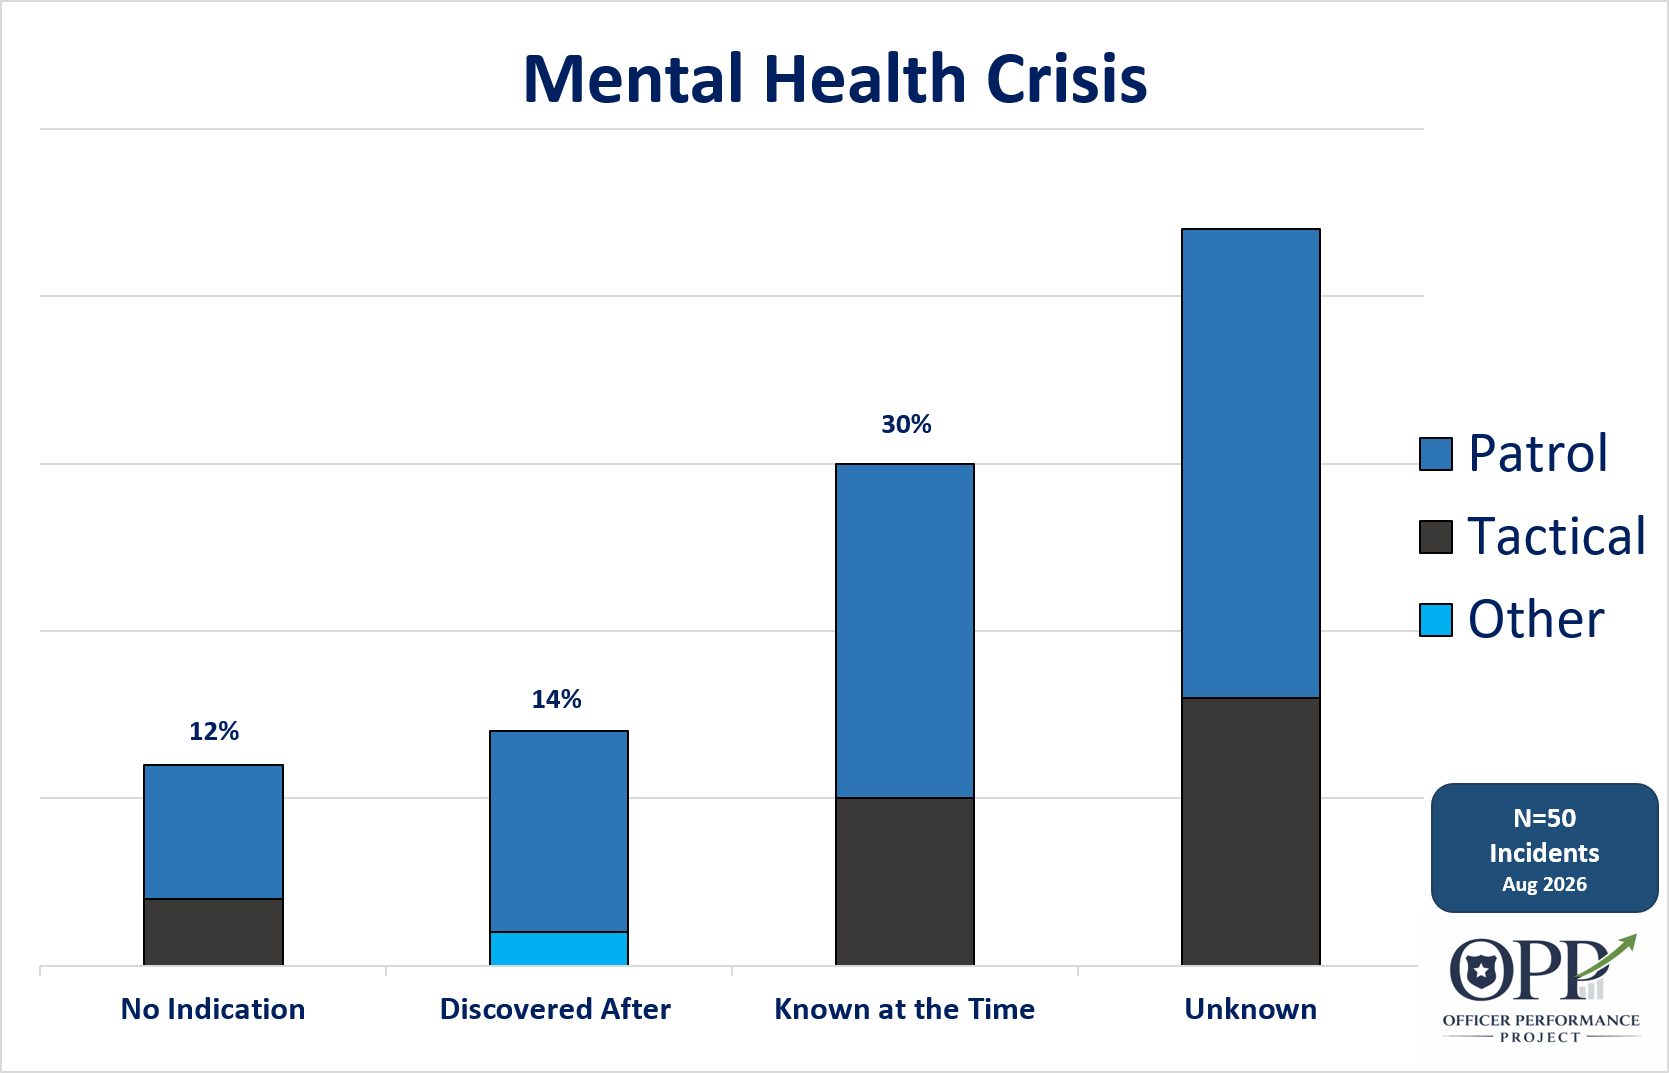
The study also attempted to determine if the subject was in a mental health crisis at the time of the incident and if the officers had that information prior to the shooting. For the majority of incidents in this data set it was unknown if the subject was in a mental health. This could be due to redacted public records in the investigative file, or because the subject’s mental health status was not relevant to the investigation.
The “Known at the Time” category was selected if the investigative file showed the officers had information in the original call, or if the officers learned the subject was in mental health crisis while on scene prior to the shooting. Because of how the information was collected for this data set, it is reasonable to assume most of the incidents categorized as “Unknown” would fall into the “No Indication” and “Discovered After” categories if more information was available.
-
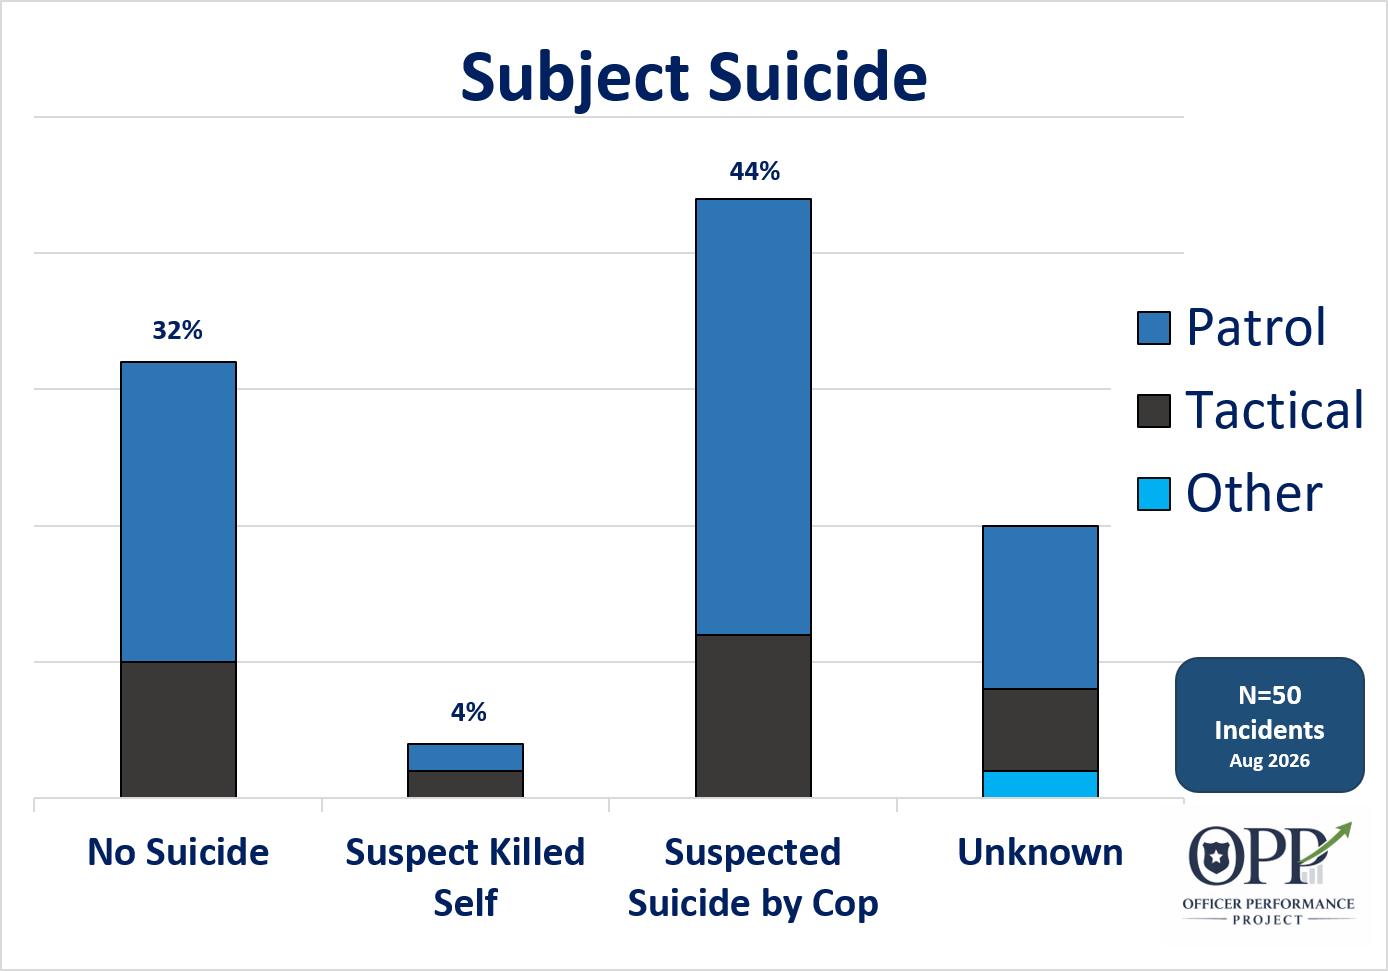
The study also looked at if officers were dealing with a suicidal subject at the time of the OIS. It is impossible to be inside another person’s head, but the investigations frequently uncovered evidence that the subject forced officers to kill them. This happened too frequently to ignore—44% of the incidents were determined to be “suicide by cop.” Which does not mean the officer(s) acted unreasonably or had any other choice but to protect themselves or others. It only means this area deserves more study.
A full explanation of the criteria used to classify an incident as “suicide by cop” is available in “Misc. & Methodology” page. Because this topic is so important, some discussion will be given here.
For a situation to be classified as “suicide by cop” there was at least some evidence or an act so irrational that it was more likely than not the suspect wanted the police to kill them. This could be any of the following: suicidal statements to the police or others during or prior to the incident; notes; pointing facsimile firearms or empty firearms at identifiable law enforcement. In the case of suicidal statements or notes, they had to be closely tied to the officer involved shooting or combined with irrational actions that were likely provoke officers to shoot.
Determining the mindset of a subject is a subjective task. It is worth noting selected details of one incident that was not classified as suicide by cop. In one instance a subject with warrants for raping a child was confronted by multiple officers who already had their guns drawn. The subject attempted to draw a loaded pistol and was killed the officers. Even though attempting to outdraw multiple officers seems suicidal, this incident was classified as “no suicide” because there was no additional information or subject statements to indicate suicide by cop.
Additionally, a subject being in a mental health crisis did not necessarily mean their death was “suicide by cop,” and every “suicide by cop” incident in the study did not also classify as a mental health incident.
-
Subjects used cover or were partially exposed to the officer 43% of the time.
Patrol officers faced a subject using cover or partially exposed 25% of the time.
Tactical officers faced a subject using cover or cover 69% of the time.
-
The subject was significantly moving when the officers where shooting for 61% of the experiences.
50% of Patrol officers faced a moving subject.
65% of Tactical officers faced a moving subject.
-
40% of the subjects continued to resist or flee after they were shot by officers.
Continued resistance included shooting, fighting, physically resisting, and fleeing after being struck by the officers’ initial rounds. It did not include normal handcuffing after an officer involved shooting.
Because the majority of incidents in this data set were fatal Officer Involved Shootings, this metric is likely skewed lower, with a higher percentage of continued resistance for non-fatal shootings.
-
87% of incidents involved officers or SWAT Medics providing first aid on scene to the subject..
The criteria for performing first aid was at least one person on scene to glove-up and provide a medical assessment. The study did not look further into what type of aid was performed as this information was frequently redacted.
Incidents where no first aid was performed in this data set involved obviously deceased persons with no signs of life and/or treatment provided to other persons on scene.
In two of the 25 incidents it was unknown if first aid was performed.
-
In 59% of the incidents the subject was transported to the hospital by EMS.
Because the majority of incidents in this data set were fatal Officer Involved Shootings, this metric is likely skewed lower, with a higher percentage of hospital transport for non-fatal shootings.