-
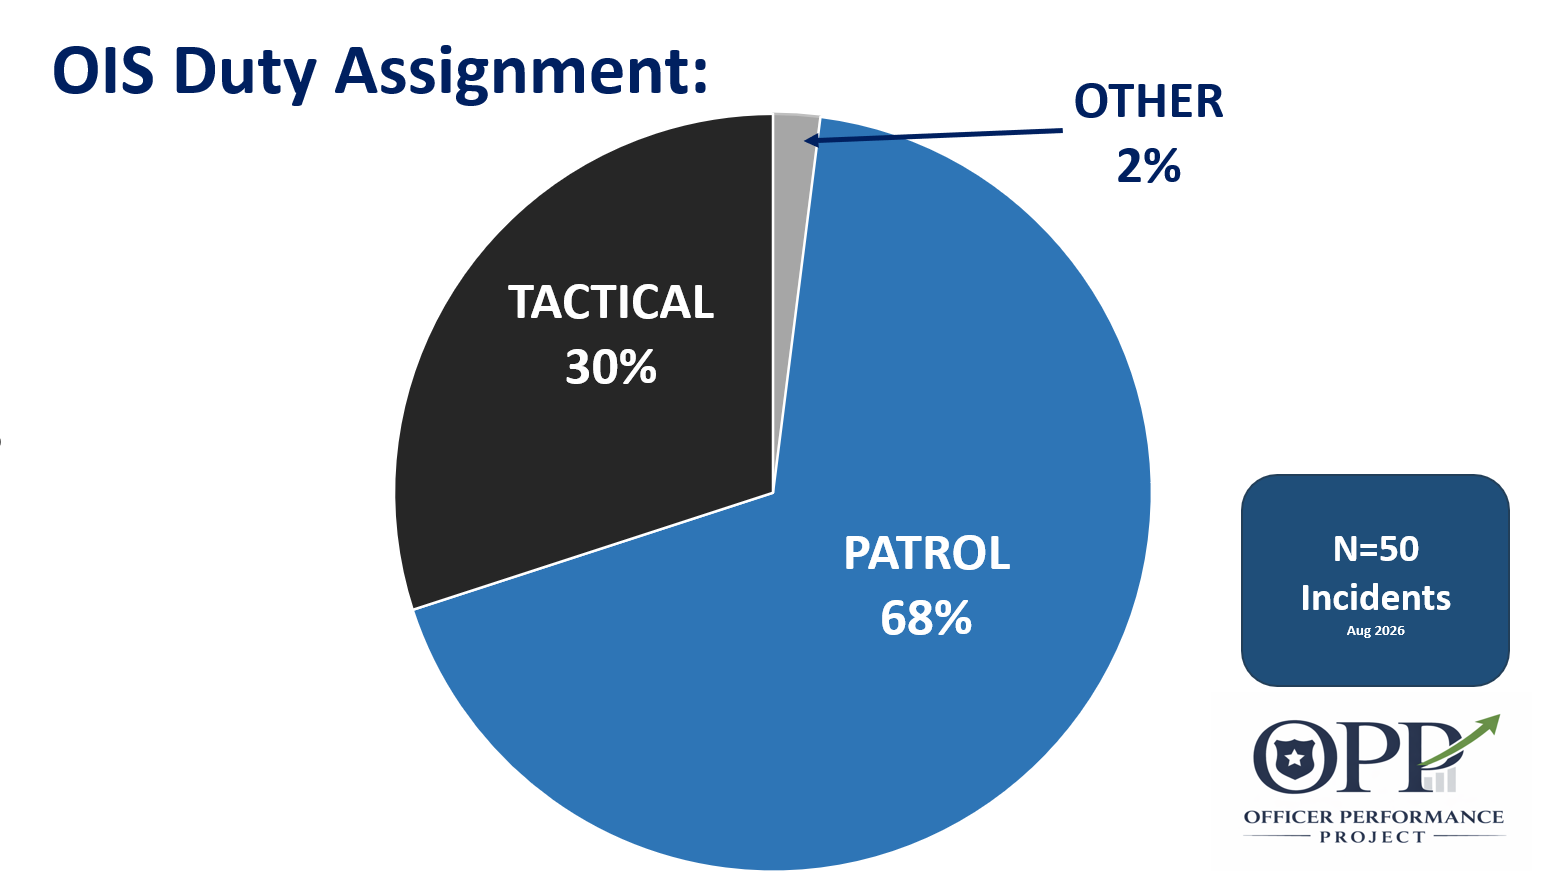
The duty assignment of the participant at the time of the OIS. For the purposes of this study:
Patrol officers wear regular police uniforms and have the primary responsibility of responding or enforcing laws.
Detectives wear plain clothes and do not overtly identify themselves as law enfacement.
Tactical officers may be SWAT, or drug-task force officers, or Marshals who are wearing vests or overt gear which identifies themselves as law enforcement.
Off-Duty are law enforcement officers working a secondary job, or incidents which occur during an officer’s non-working hour. They may or may not be wearing a regular police uniform at the time of the OIS.
Other covers situations not listed above, such as bailiff’s performing an eviction, or other law enforcement officers.
-
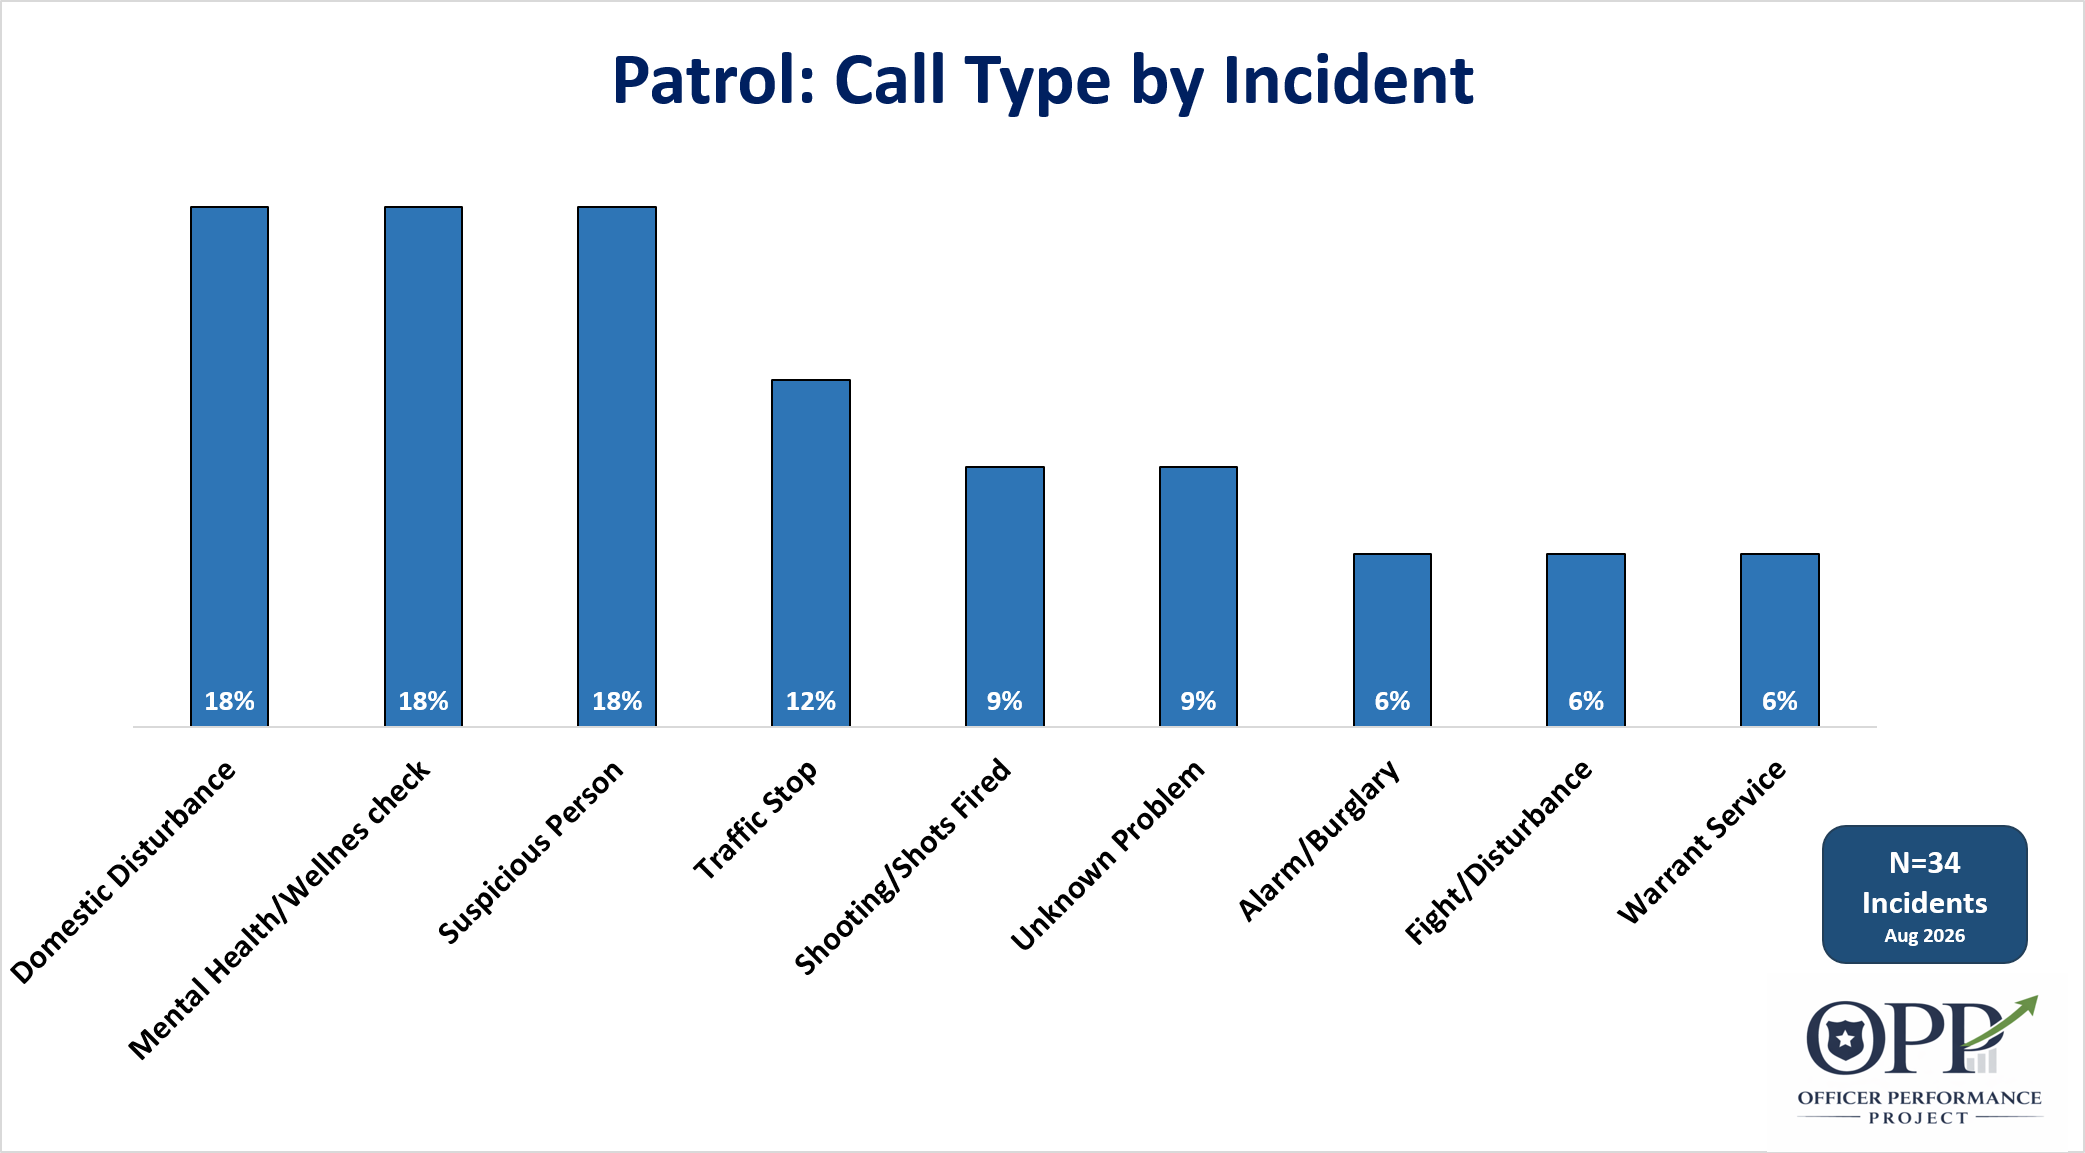
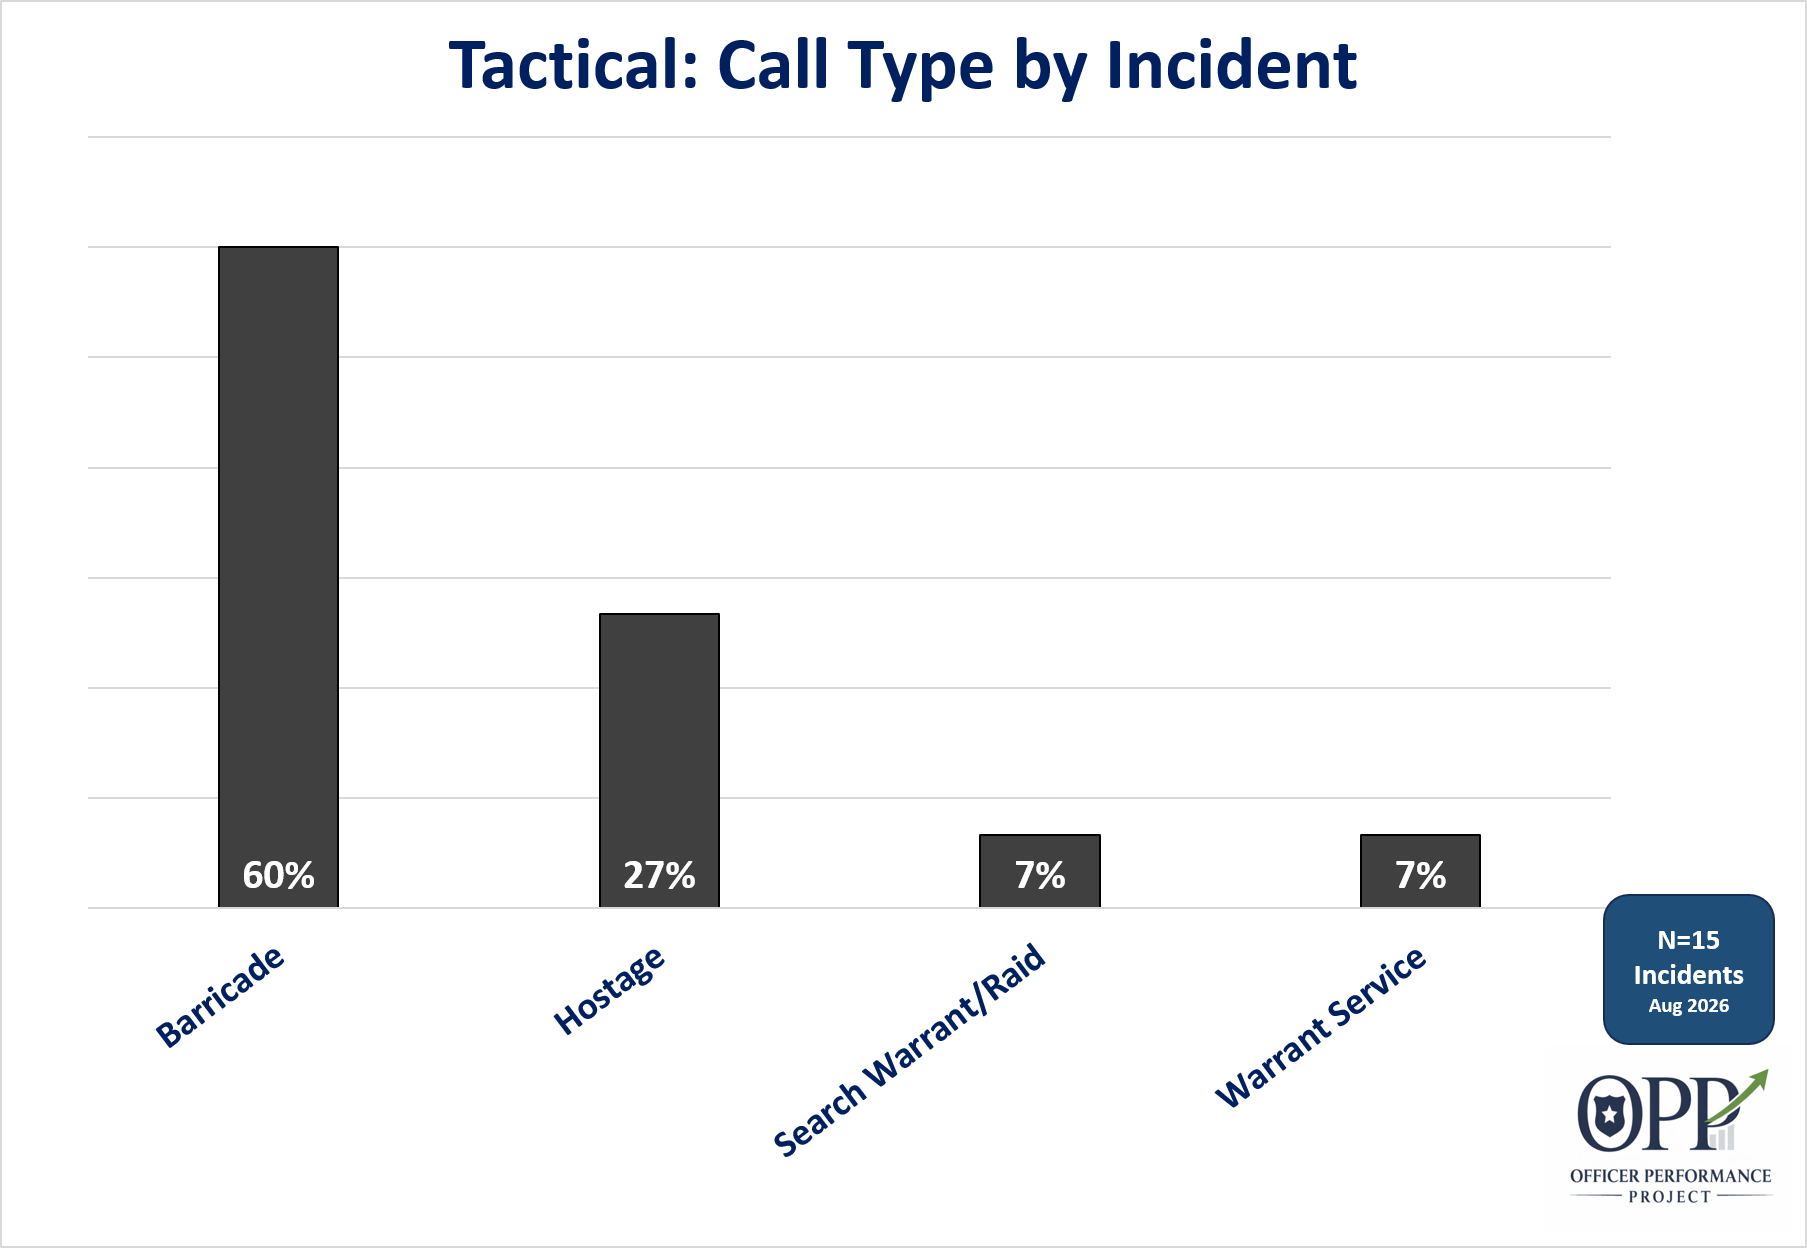
The type of call the officer responded to or initiated prior to arriving on scene.
For patrol officers this will generally be how the call was coded by dispatch, although in some cases “fight” will be upgraded to “domestic dispute” for accuracy.
For non-patrol officers this will generally be how a reasonable law enforcement officer filling the same role would classify the call.
-
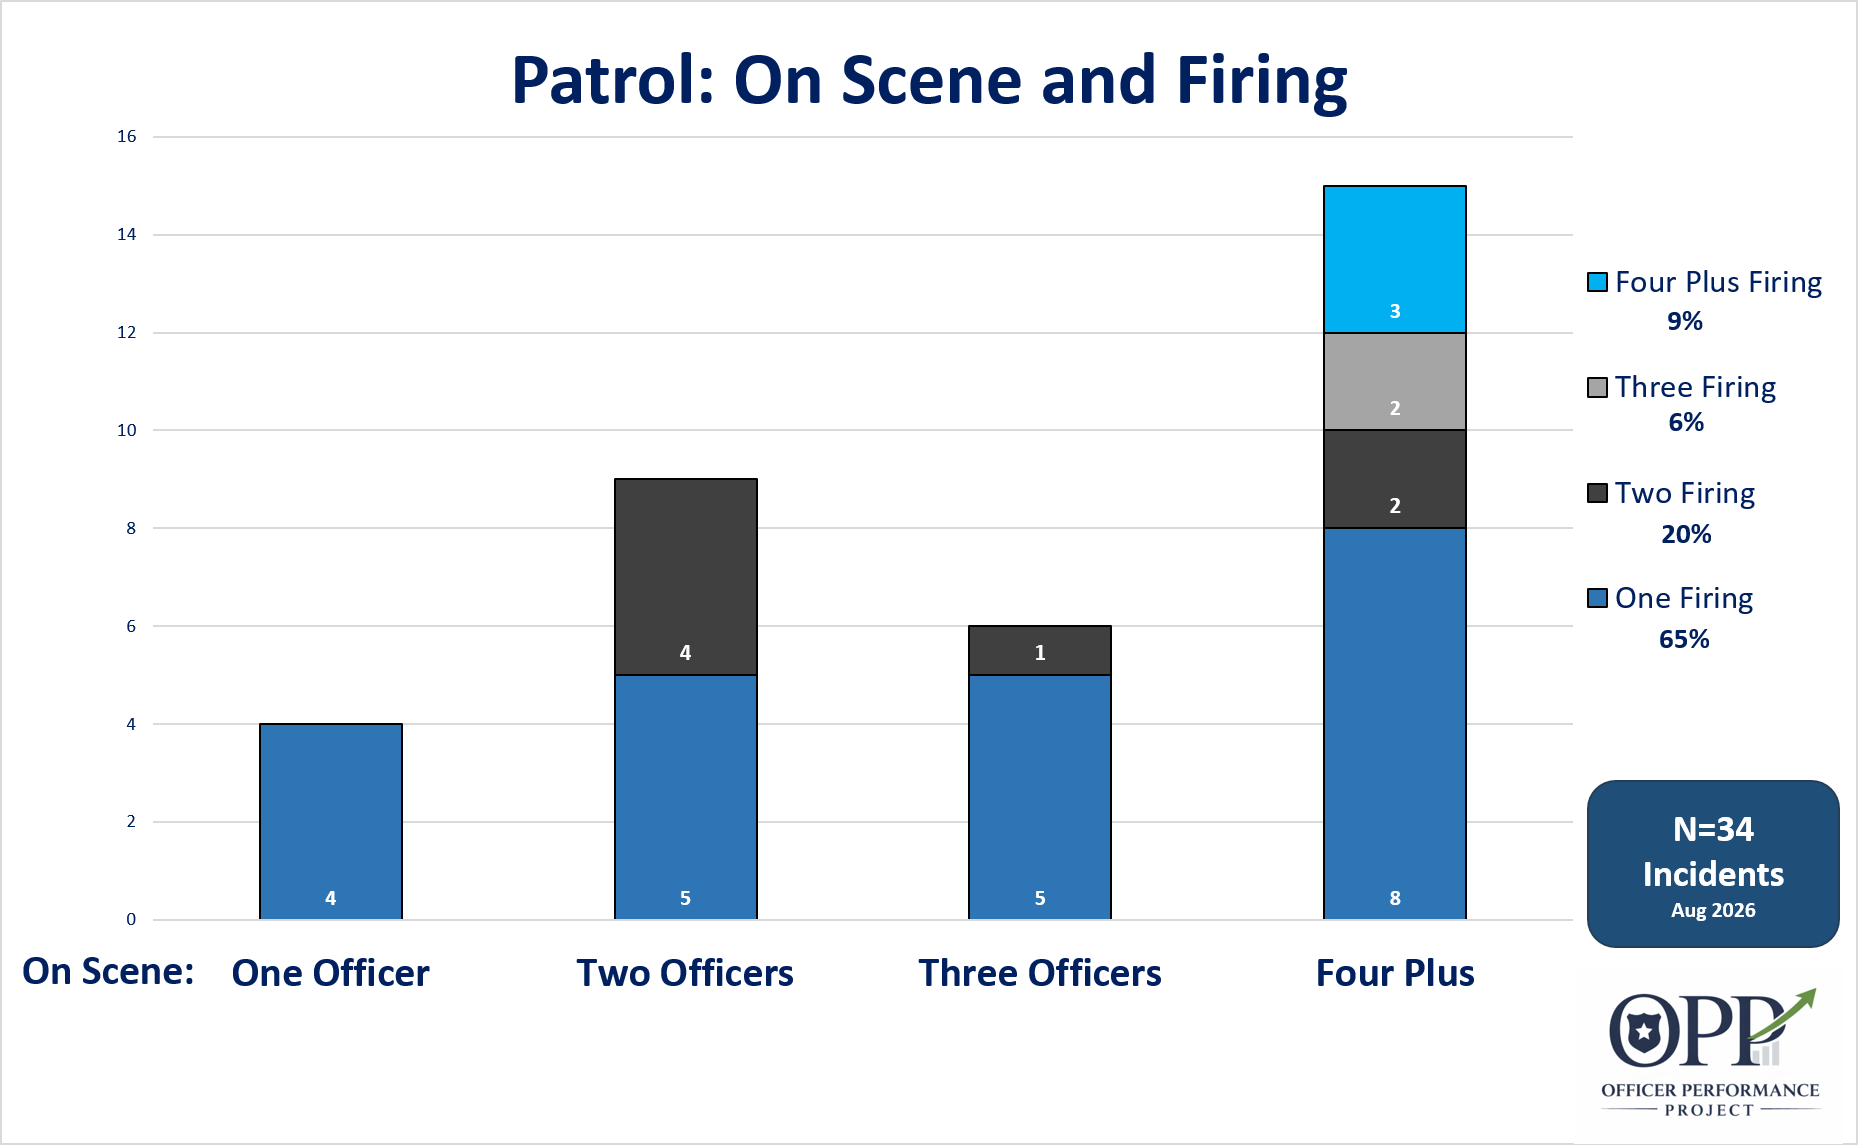
Of the 34 patrol shootings analyzed in the study, only 3 involved four or more officers on scene and firing their weapons. As the chart below shows, the majority of OIS’s with more than three officers on scene involved a single officer firing rounds with the remaining officers not shooting.
Additional Points:
12% of the incidents involved a solo officer.
24% of the incidents were multi-jurisdictional.
3% occurred outside the officer’s jurisdiction.
50% had a supervisor on scene when shots were fired.
24% involved a supervisor firing rounds.
No plainclothes officers were on scene for this data set.
91% had some video of the incident.
-
Of the 15 SWAT shooting incidents analyzed, all had more than four officers on scene at the time of the shooting. 40% of the incidents involved a single officer firing rounds.
Additional Points:
87% of the incidents were multi-jurisdictional.
80% had some video of the officers.
93% had a supervisor on scene.
33% had a supervisor on scene who fired rounds.
8% had plainclothes officers who were in the immediate area of the shooting.
-
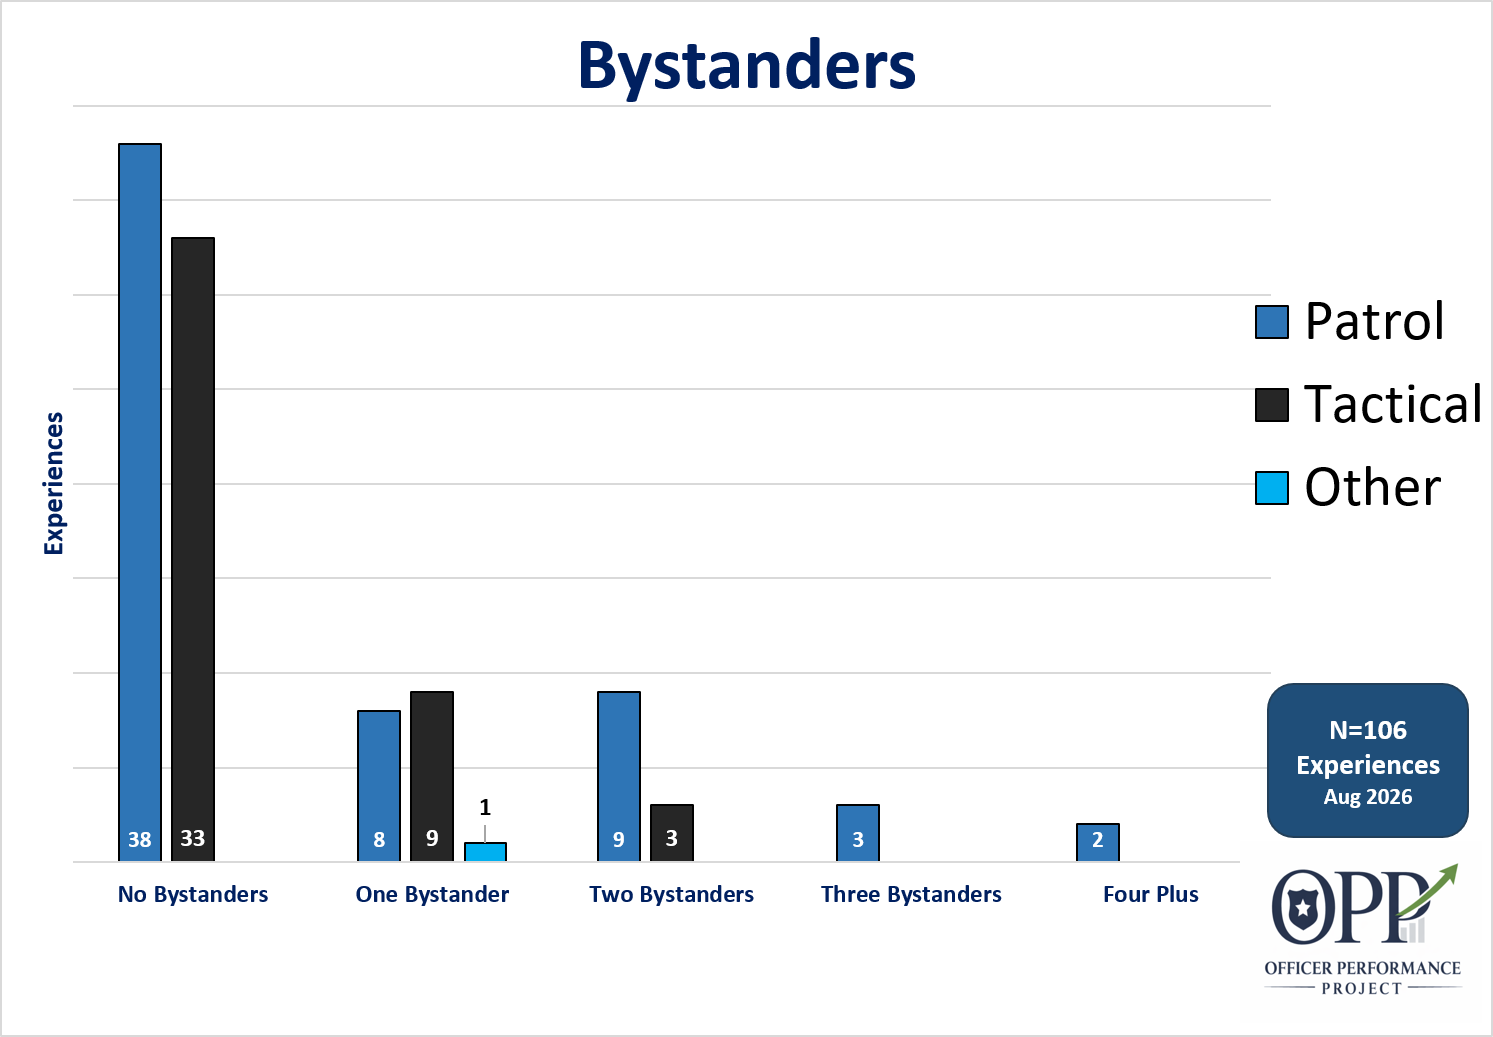
“Bystanders” includes uninvolved third parties, co-conspirators who do not pose a deadly threat, and other officers.
· 49 of the 50 incidents involved one subject who posed a deadly threat to officers. The incident with two armed subjects was a tactical incident.
· 37% of patrol officers who fired rounds also had bystanders on scene during the incident.
· 27% of tactical officers who fired rounds had bystanders on scene.
-
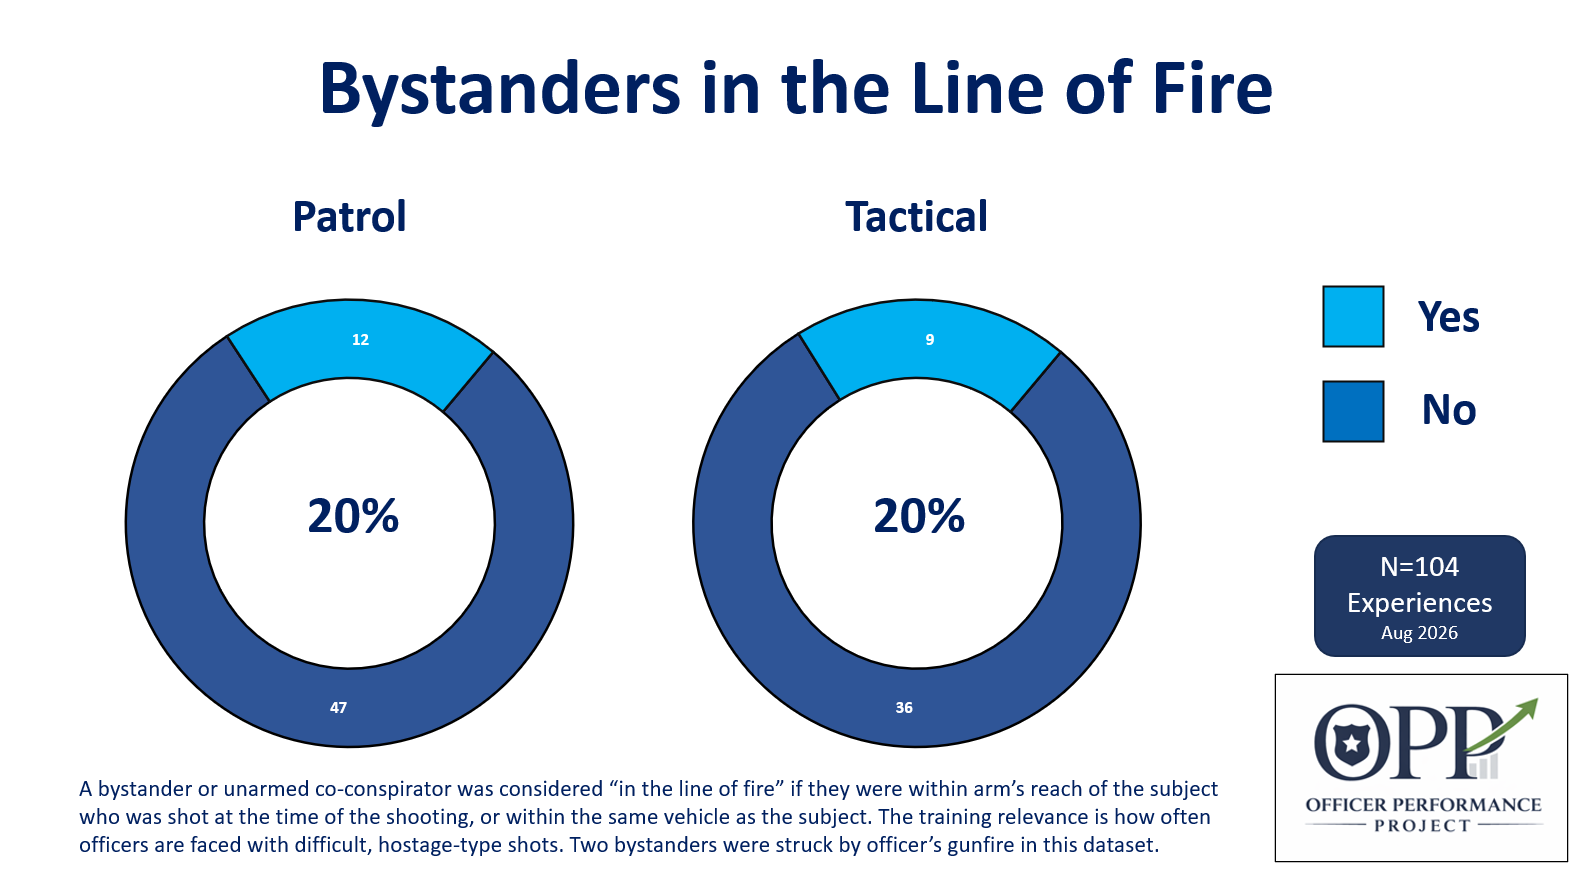
A “bystander” was considered “in the line of fire” if they were within arm’s reach of the subject who was shot at the time of the shooting, or within the same vehicle as the subject. The training relevance is how often officers are faced with difficult, hostage-type shots. Two bystanders were injured in this dataset: one minor graze and one co-conspirator was fatally shot by a police round that passed through a vehicle. For one omitted experience it was unknown if bystanders were the line of fire.
-
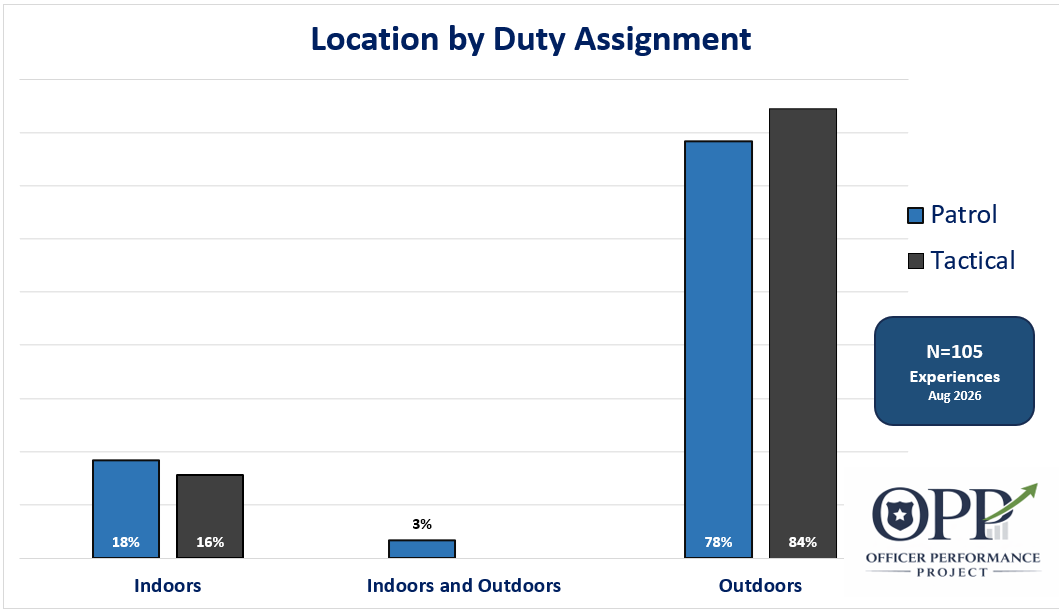
Of the 106 officers who fired rounds in the data set, 80% were outside during the shooting, 18% were inside, and 2% were inside and outside during the same shooting.
Patrol officers were slightly more likely to be involved with a shootings indoors.
-
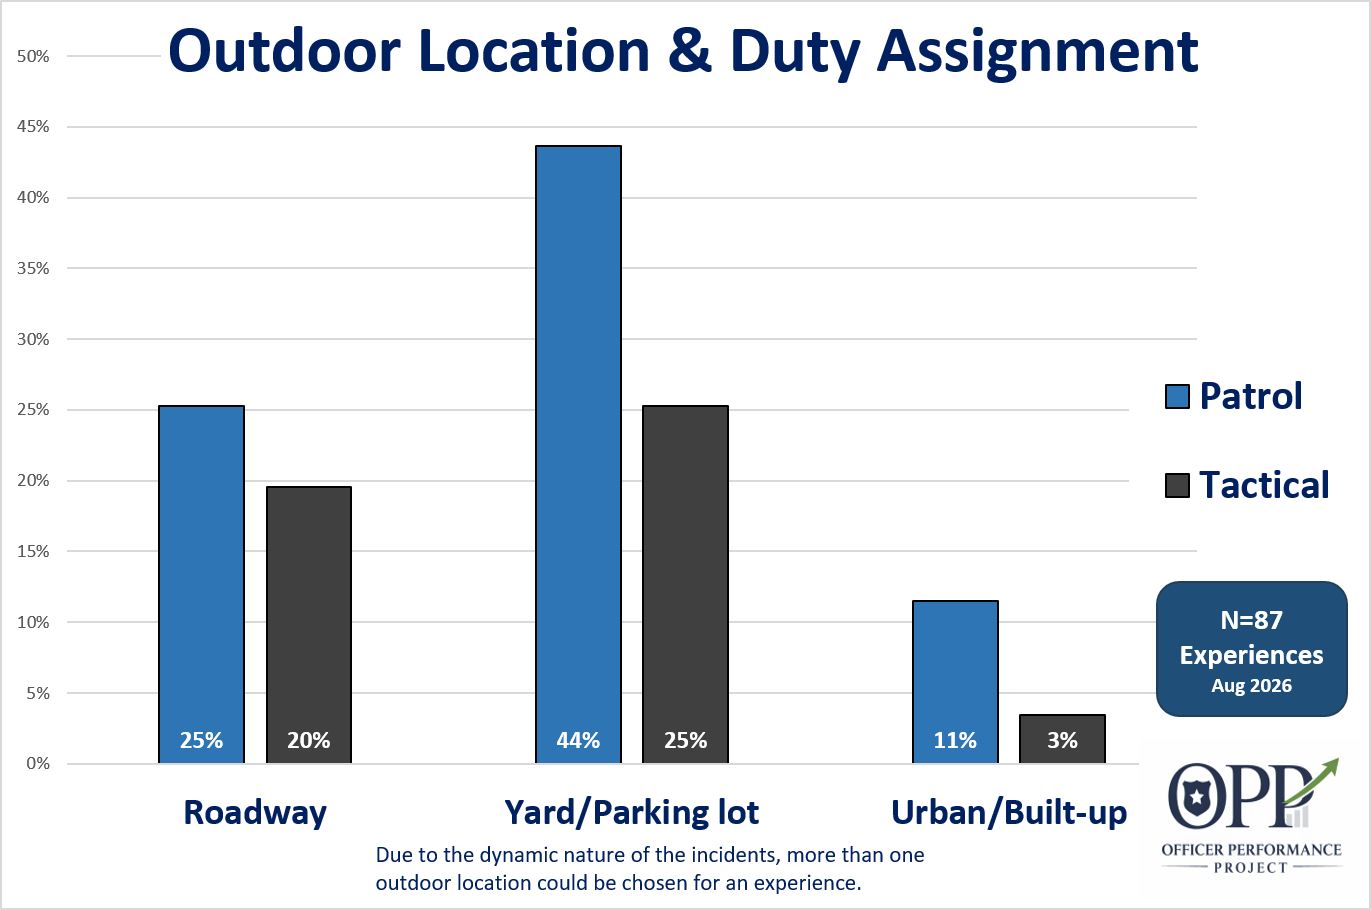
49 patrol experiences were outdoors. 38 tactical experiences were outdoors.
Unlike the indoor shootings, outdoor incidents generally only occurred at one outdoor location type.
-
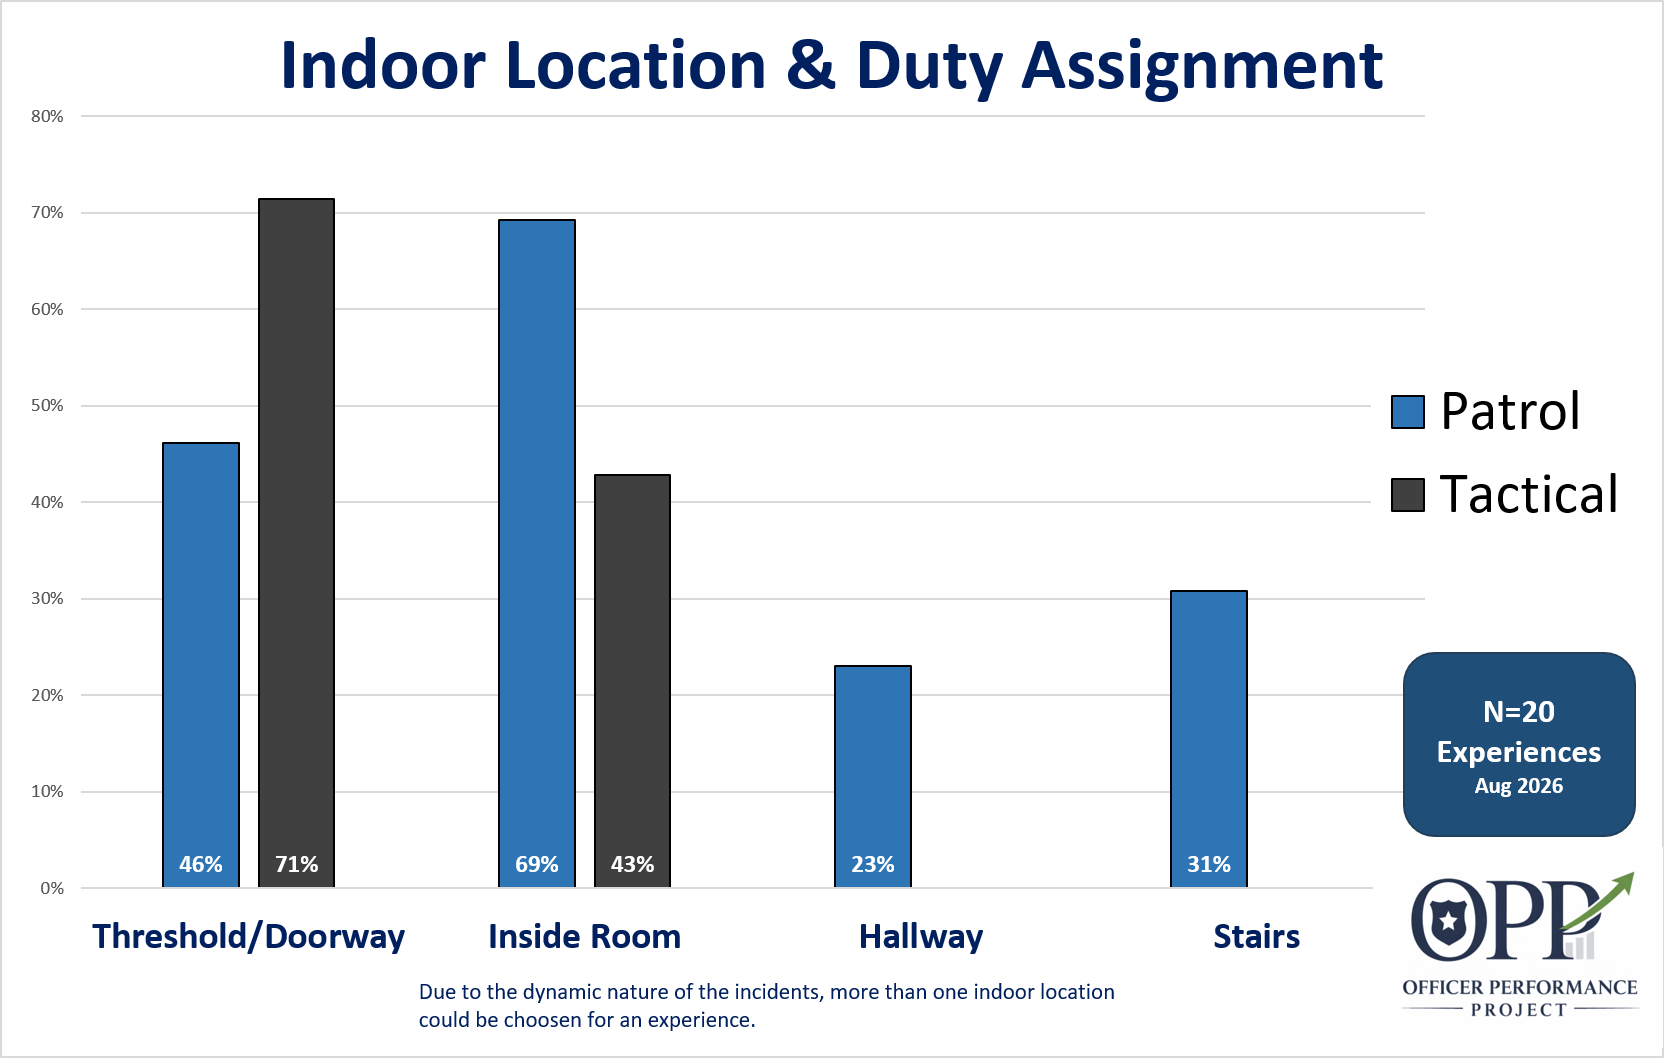
There were 20 total experiences. that took place indoors. 13 were patrol and 7 were tactical. Due to the dynamic nature of the shootings, more than one location could be chosen for an event, and frequently was for patrol officers.
-
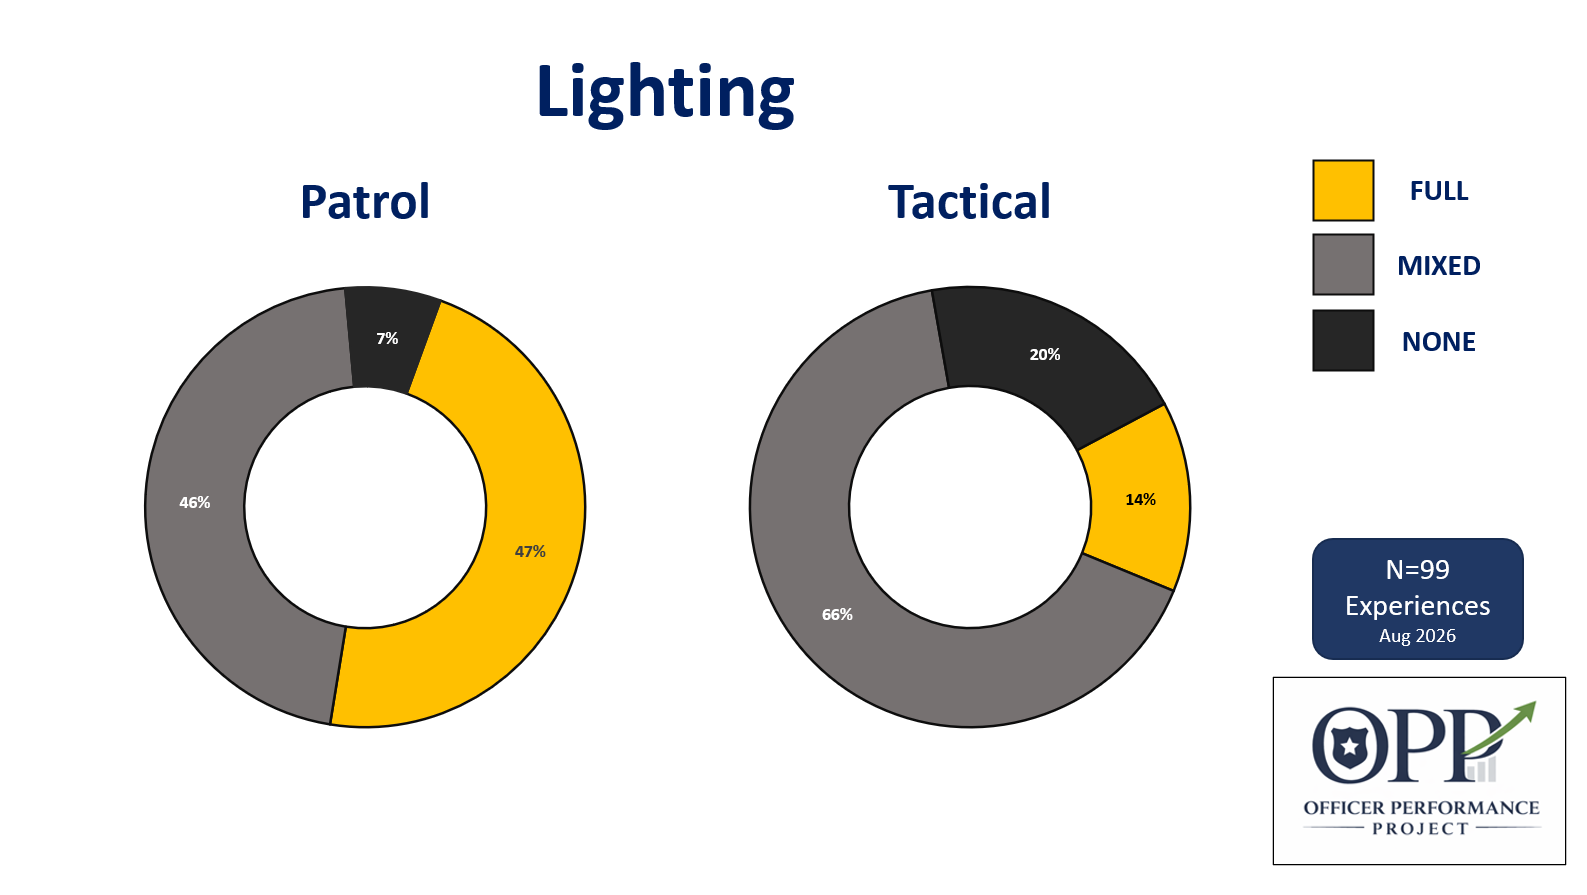
“Full lighting” means daylight or a fully lit room. No external light is necessary from the officer.
“Mixed” would be dusk or urban night with streetlights. External lights from the officer would be optional.
“None” means darkness and an external light source would be necessary to visually identify threats.
For 8 experiences the lighting conditions were not known.
-
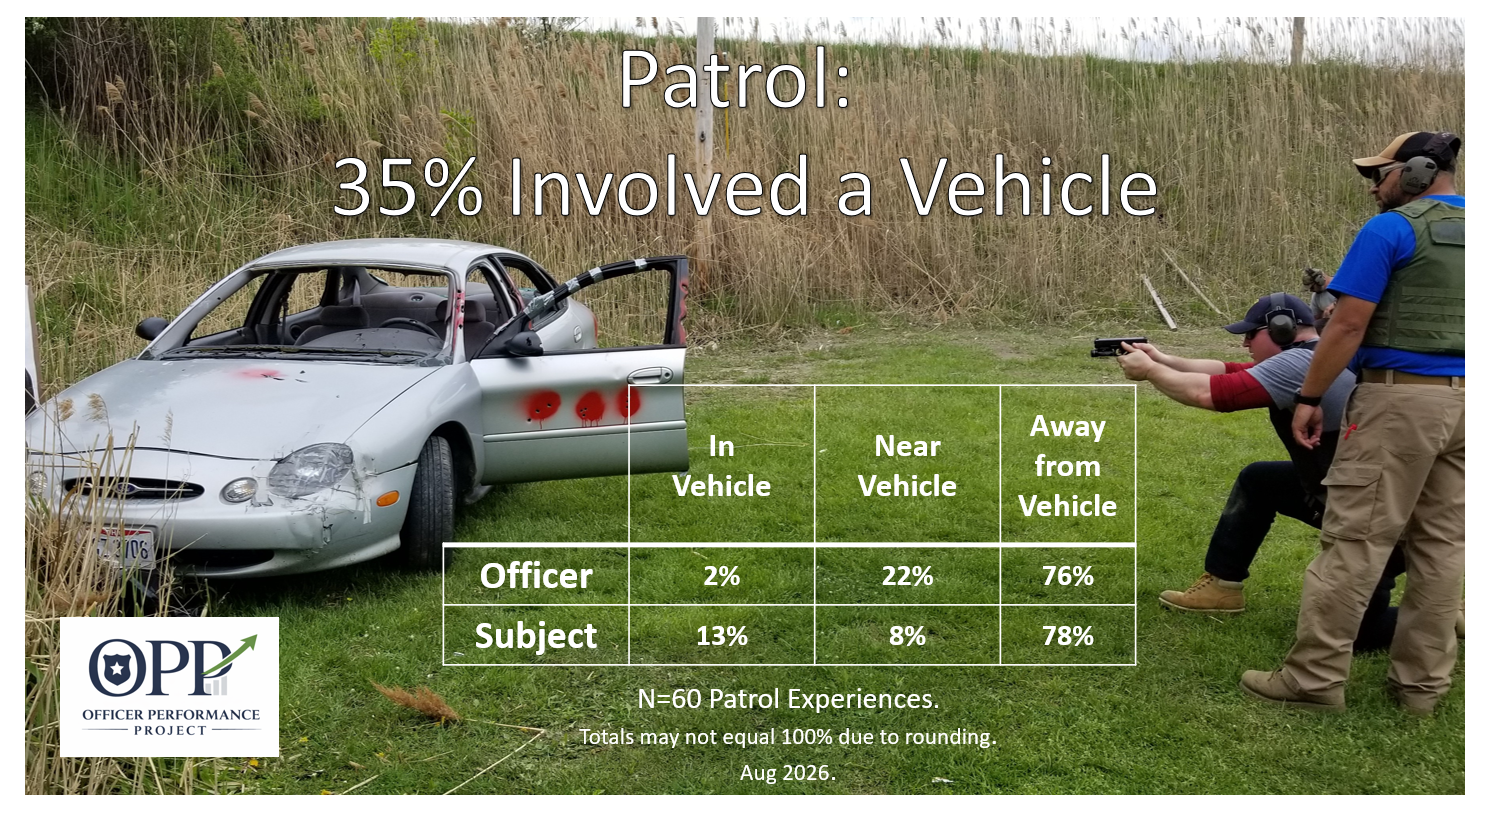
For 35% of the patrol experiences either the officer who fired shots, the subject, or both were near a vehicle.
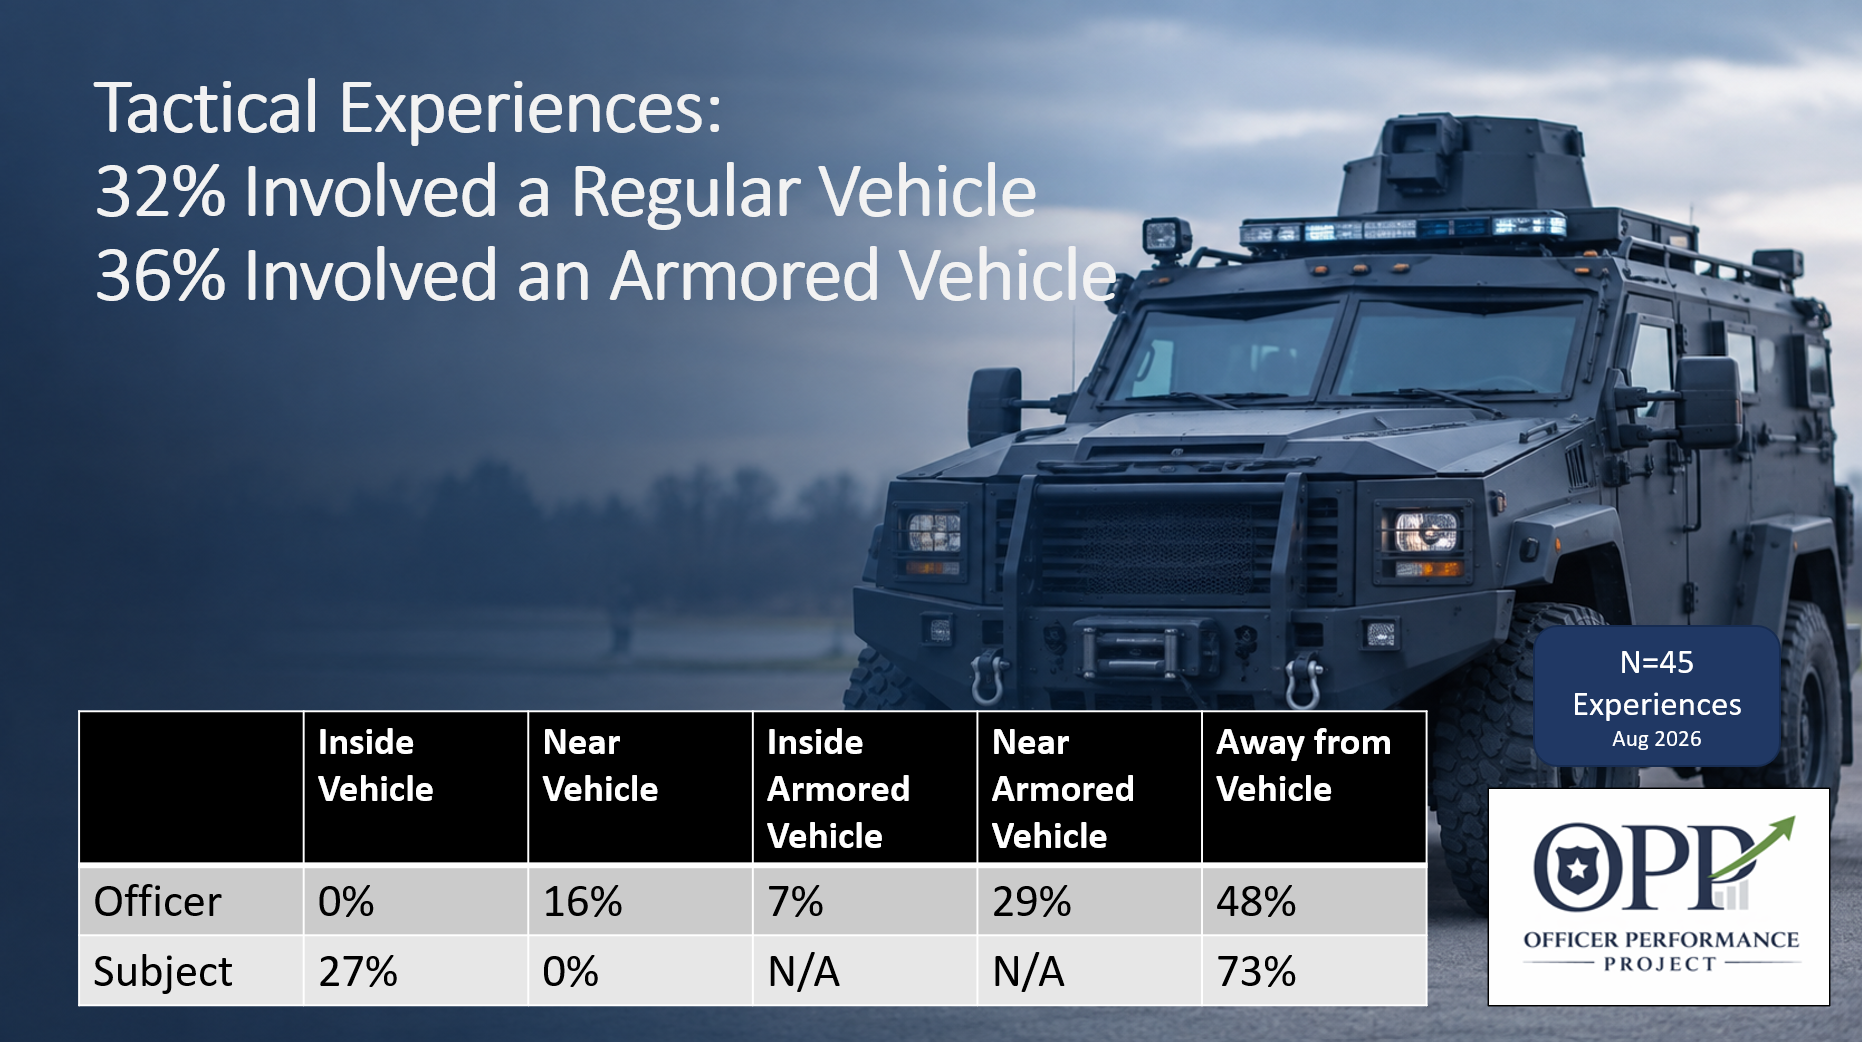
22% of tactical experiences involved a vehicle.
The accompanying graphic offers more details on how the participants and vehicles were involved in the incidents.
For the purposes of this study, “vehicles” are passenger vehicles such as sedans, trucks, side-by-sides, etc.. that have an enclosed or partially enclosed passenger compartment. A participant was considered “near a vehicle” if they were within arm’s reach of the vehicle at some point during the shooting.
Because of their unique nature and training requirements, armored vehicles were considered it’s own vehicle class for the purposes of this study. For more details on the criteria and how data was collected, check the “Misc & Methodology” page.